Care Plan as an Effective Service Tool to Improving Well-being of Vulnerable Households: A Case Study of Lagos and Calabar, Nigeria
 , Eseoghene Fredrick Arigbe MBBS4, David Akpan PhD5, Jimin Sontyo PhD6, Elijah Idoko MPH7

*Corresponding author: Akinwale Johnson Ogundipe, Department of Health Management, International Telematic University, Uninettuno, Rome, Italy.
-
Received: ,
Accepted: ,
ABSTRACT
Background and Objective:
Over the years, efforts have been made through public health interventions and policy design to implement programs aimed at addressing economic, structural, and human factors contributing to household vulnerability across developing countries. Care plan development is the process of identifying specific goals and interventions required to improve the well-being of vulnerable individuals and families, with discrete actions needed to achieve such goals. The objective of this study is to evaluate the effectiveness of the care plan in enhancing the well-being of vulnerable households in various communities across Cross River and Lagos States.
Methods:
This study compared and analyzed data collected using the National Household Vulnerability Assessment tool at baseline and follow-up after 2 years (2016–2018) from 406 households in Cross River and Lagos State, covering 14 communities across six local government areas. Changes in the vulnerability status of households, in relation to the effective use of care plans for service provision and intervention monitoring, were identified, and analyses were conducted to determine the significance of these effects.
Results:
Findings of this study showed that out of a total of 226 households assessed in Cross River State, 174 (76.99%) which were in the “More Vulnerable category” at baseline reduced to 120 (53.09%), while those in the Most Vulnerable category representing 0.88% (2 households) during the baseline study reduced to 0% after the administration of the care plan. In Lagos, out of 180 households sampled, 142 (78.88%) in the “More vulnerable category” at baseline reduced to 81 (33%) at follow-up, while seven households (3.88%) reported as “Most vulnerable” at baseline, reduced to 1 (0.55%). In measuring the effectiveness of the care plan on the above changes in vulnerability status, a t-test analysis indicated that 13 of the 14 communities in Lagos State and all five (5) communities sampled in Cross River showed a significant influence of the care plan. The results showed that highly significant differences between the baseline and follow-up vulnerability levels at p < 0.05 across the investigated communities.
Conclusion and Implications for Translation:
The care plan had a positive and significant impact on improving the well-being and vulnerability status of vulnerable households in Lagos and Cross River. A care plan should therefore be considered a valuable service tool in guiding and monitoring interventions required to improve the well-being of vulnerable individuals and households.
Keywords:
Care Plan
Community
Households
Intervention
Service Tool
Vulnerable
INTRODUCTION
Care plans are an essential service delivery tool that improves the well-being of vulnerable households through structured coordination, empowerment, and service integration.[1] They function as systematic procedures for identifying needs, setting goals, and implementing and monitoring interventions tailored to individual or household circumstances. Vulnerable households can be defined as those facing socioeconomic, health, or psychosocial challenges. They often struggle with fragmented services and unmet needs.[2,3] A well-designed care plan is context-sensitive, time-bound, individualized, and family-centered, aiming to achieve measurable improvements in household well-being.
In this study, household vulnerability is defined as the inability of households to meet the minimum standards of well-being consistently over time. This condition is prevalent in low-income developing economies, where households are exposed to multiple stressors, including income instability, inflation, disease outbreaks, flooding, civil unrest, and vulnerability to economic, political, and environmental crises.[4,5] These challenges tend to hit hardest on households and individuals who are least equipped to handle such shocks. In response, various public health and development agencies have implemented programs aimed at addressing some of the challenges contributing to household vulnerability in developing countries.[6] Agencies, such as the World Bank, United Nations Development Programme, United States Agency for International Development (USAID), and Department for International Development, have developed and implemented packages and programs targeting the poorest of the poor in countries where households live on <$100 a day.[7-9]
Despite these efforts, there is limited empirical evidence on the effectiveness of the care plans in reducing household vulnerability. Specifically, the extent to which care plans and the services provided, such as health referrals, educational support, food assistance, shelter improvement, and livelihood strengthening, contribute to measurable improvements remains underexplored.
This study evaluates the effectiveness of care plans in improving the well-being of vulnerable households in program communities in Lagos and Cross River states, Nigeria. The independent variable is the implementation of the care plan, while the change in the household vulnerability status over time is the dependent variable. Outcomes were quantified in terms of vulnerability score differences across eight dimensions: Health, household headship, education level, shelter and housing, food security and nutrition, livelihood means, and household income. Scores were assessed at baseline and 2 years following the execution of the care plan. This study aims to contribute to the evidence base on care planning as a valuable strategy for reducing household vulnerability and informing service provision in contexts of scarcity.
Conceptual framework of care plans
Care plans are grounded in person-centered and holistic care models, emphasizing the integration of physical, psychological, and social needs. The theoretical basis draws from case management theory,[10] the social determinants of health model,[11,12] and empowerment theory.[13] These frameworks support the idea that care plans promote equity and tailored interventions for families and individuals in precarious conditions.
METHODS
Study Design
This study adopted a mixed-method, comparative case study design to examine the effectiveness of care plans in improving the well-being of vulnerable households in Lagos and Calabar, Nigeria. The case management process is indicated in Figure 1. Quantitative data were collected through a cross-sectional survey of selected households in both cities to assess the presence and impact of care plans on well-being indicators. Complementary qualitative data were gathered through in-depth interviews with household members and service providers to explore experiences, challenges, and perceived outcomes of care plan implementation. This design allows for both a broad analysis of patterns and an in-depth understanding of contextual factors influencing care plan effectiveness.
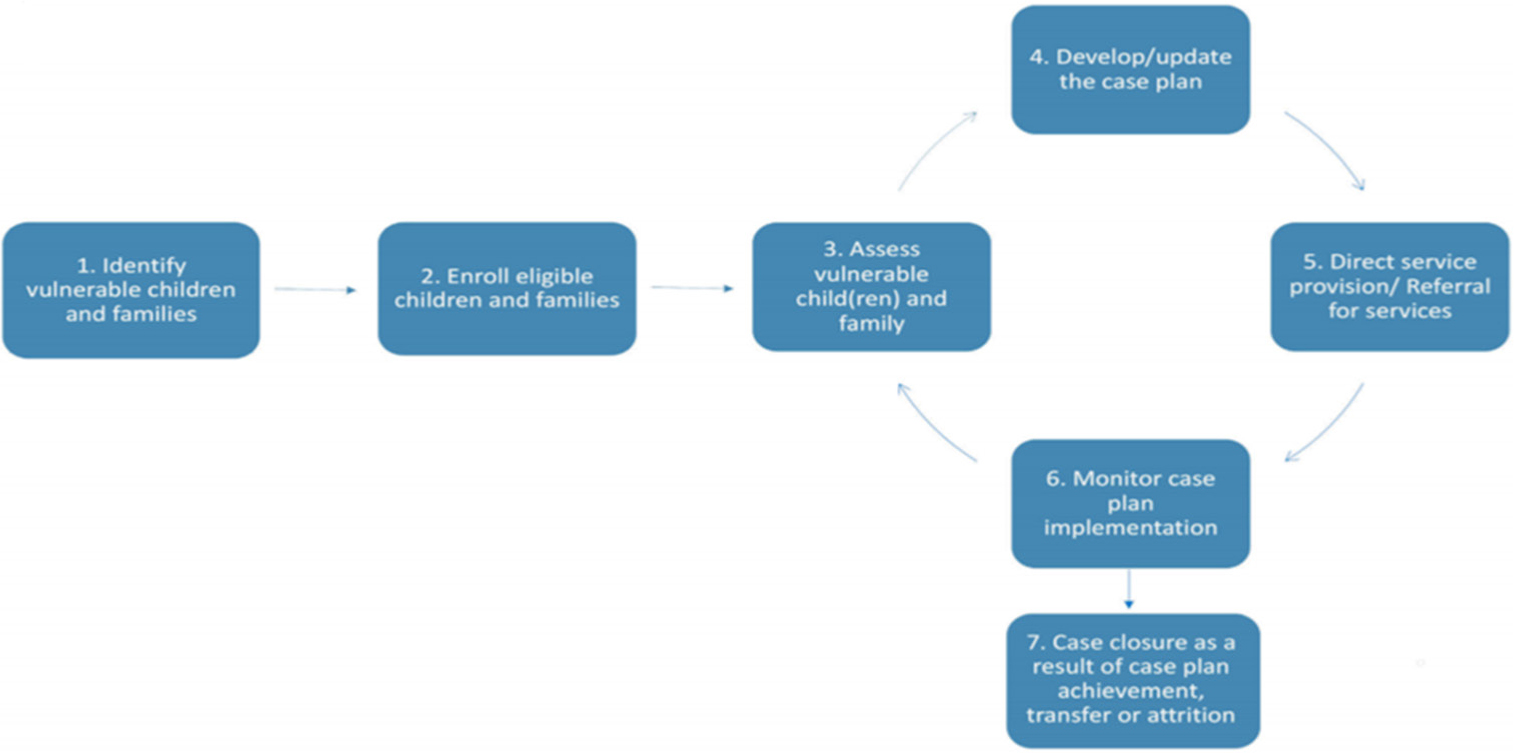
- Case Management Process: Graphic informed by Centre for International Social Work at Rutgers University’s School of Social Work and International Social Service-USA for USAID.
The Study Area
This study was conducted in two states in Nigeria, namely Lagos and Cross River State. A total of 14 communities, distributed across six local government areas, as indicated in Table 1, were assessed. The selection of these communities was based on the population and the increasing number of vulnerable households.[14]
| State | LGAs | Communities | ||
| Lagos | Apapa | Waterside | Area Barracks | Queens Barrack |
| Agege | Keke | Oke-koto | Atobaje | |
| Surulere | Airways | Akinhanmi/ Cole | Iponri/Eric Moore | |
| Cross River | Akpabuyo | IkotEdemOdo | ||
| Calabar | Obutong | Ekorinim 1 | IkotAwatim 2 | |
| Odukpani | Odukpani Qua | |||
LGAs: Local government areas
Study Population
The total population was 406 households, divided into 226 households from Cross River and 180 from Lagos State. Households typically comprise a father, mother, and children, with an average household population size of approximately four to six. Only the head of the household was expected to respond to closed-ended questions that sought to address issues regarding their vulnerability and the effectiveness of the care plan; males and females were included. Occupations of the sample population include food vendor, cleaning, farmer, bike rider, secretary, etc.
Study Variables
The study employed both independent and dependent variables to evaluate the effectiveness of care plans in improving the well-being of vulnerable households.
Independent Variable
Health, Household Headship, Education Level, Shelter and Housing, Food, Security and Nutrition, Means of Livelihood, and Household Income.
Change in Vulnerability Status (Dependent Variable)
The difference in the household vulnerability assessment (HHVA) scores between the baseline and follow-up assessments depended on the independent variable. It reflects the effectiveness of the care plan administration in reducing household vulnerability.
Collection of Data
Data were sourced from the National OVC Management Information System, which tracked household vulnerability metrics. Household baseline data were collected at the beginning of the program using the standardized National HHVA tool. A yearly repeat assessment was carried out on the households using the HHVA-follow-up tool, which measured the same indicators to monitor changes over time. The assessment tools captured multidimensional indicators across eight domains: Health, Household Headship, Education Level, Shelter and Housing, Food, Security and Nutrition, Means of Livelihood, and Household Income. Each domain had specific indices with assigned ratings. The cumulative score of all indicators determined the household vulnerability status:
- Most vulnerable – score of 21–28
- More vulnerable – score of 14–20
- Vulnerable – score of 8–13
- Not vulnerable – score of 7
The care plan was administered at the household level and monitored over 2 years using national standard tools. Data from 406 households were collected at baseline and followup over 2 years (2016–2018), allowing for a comparative analysis of vulnerability dynamics across the households.
Data Analysis
General descriptive statistics using frequency tables, simple means, and percentages were applied. The simple percentage tool was used to show the frequency of responses and the total number of respondents. To assess the changes between baseline and follow-up data, variables were subjected to Student’s t-test. The accepted level of statistical significance was set at p < 0.05, suggesting that observed differences were considered statistically significant if the probability of occurrence by chance was <5%.
RESULTS
The gender distribution of the respondents in Cross River and Lagos State is shown in Tables 2 and 3, respectively. Also indicated are the Local Government Areas and the Communities.
| S. No. | LGAs/ Communities | Male (%) | Female (%) | Total (%) |
| 1. | Akpabuyo/Ikot Edem Odo | 17 (54.8) | 14 (45.16) | 31 (100) |
| 2. | Calabar/Obotong | 12 (41.37) | 17 (58.52) | 29 (100) |
| 3. | Calabar/ Ekorinim 1 | 19 (32.22) | 40 (67.79) | 59 (100) |
| 4. | Calabar/Ikot Awatim 2 | 26 (65) | 14 (35) | 40 (100) |
| 5. | Odukpani/ Odukpani Qua | 29 (43.28) | 38 (56.71) | 67 (100) |
| Total | 103 (45.57) | 95 (54.42) | 226 (100) |
LGAs: Local government areas
| S. No. | LGAs/Communities | Male (%) | Female (%) | Total (%) |
| 1. | Apapa/Waterside | 8 (42.10) | 11 (57.89) | 19 (100) |
| 2. | Apapa/Area B Barracks | 8 (53.33) | 7 (46.66) | 15 (100) |
| 3. | Apapa/Queens Barracks | 14 (73.68) | 5 (26.31) | 19 (100) |
| 4. | Agege/Keke | 2 (10.52) | 17 (89.47) | 19 (100) |
| 5. | Agege/Oke-Koto | 8 (42.10) | 11 (57.89) | 19 (100) |
| 6. | Agege/Atobaje | 7 (29.16) | 17 (70.83) | 24 (100) |
| 7. | Surulere/Airways | 16 (84.21) | 3 (15.78) | 19 (100) |
| 8. | Surulere/ Akinhanmi/Cole | 9 (45.00) | 11 (55.00) | 20 (100) |
| 9. | Surulere/Iponri/Eric Moore | 13 (50.00) | 13 (50.00) | 26 (100) |
| Total | 85 (47.22) | 95 (52.77) | 180 (100) |
LGAs: Local government areas
Baseline and Follow-up Vulnerability Level
The results of the t-test carried out for the different communities in Cross River and Lagos state are shown in Tables 4 and 5, respectively, comparing the baseline vulnerability score and the follow-up vulnerability score. Also indicated are the p-values (Level of Significance difference) between the two scores.
| LGA/Community | Baseline vulnerability X±SD | Follow‐up Vulnerability X±SD | t‐test (2‐tailed) | Level of significance at P<0.05 |
| Calabar/Obotong (n=29) | 16.24±2.47b | 15.00±1.65c | 0.023309 | Significant difference |
| Calabar/Ekorinim 1 (n=59) | 15.10±1.50d | 13.89±2.25e | 0.000494 | Significant difference |
| Calabar/IkotAwatim 2 (n=40) | 9.82±3.74f | 12.75±2.63g | 0.24722E-05 | Highly significant difference |
| Odukpani/Odukpani Qua (n=67) | 16.38±2.29h | 13.34±2.56i | 5.3892E-12 | Significant difference |
Means with different superscripts in the same row are significantly different from one another (P<0.05). X: Mean, SD: Standard deviation, LGAs: Local government areas
| LGA/Community | Baseline vulnerability X±SD | Follow‐up vulnerability X±SD | t‐test (2‐tailed) | Level of significance at P<0.05 |
| Apapa/waterside (n=19) | 13.52±1.74a | 13.21±1.96a | 0.625245 | No Significant difference |
| Apapa/Area B barracks (n=15) | 15.00±2.42b | 12.33±2.12c | 0.00456 | Significant difference |
| Apapa/Queens barracks (n=19) | 13.78±1.58d | 10.68±2.49e | 4.96445E-05 | Significant difference |
| Agege/Keke (n=19) | 17.10±2.57f | 14.94±1.71g | 0.0036230 | Highly significantly different |
| Agege/Oke-Koto (n=19) | 17.57±2.79h | 13.42±2.09i | 0.00011601 | Significant difference |
| Agege/Atobaje (n=24) | 16.12±2.09j | 13.58±1.83k | 6.73398E-07 | Highly significantly different |
| Surulere/Airways (n=19) | 18.15±3.18l | 15.57±3.43m | 0.034844 | Significant difference |
| Surulere/Akinhanmi/Cole (n=20) | 18.30±1.92n | 13.15±2.05o | 3.72027E-09 | Highly significantly different |
| Surulere/Iponri/Ericmoore (n=26) | 16.69±2.58p | 14.26±2.69q | 0.000955 | Significant difference |
Means with different superscripts in the same row are significantly different from one another. X: Mean, SD: Standard deviation, LGAs: Local government areas
Tables 6 and 7 show the number of households in the different categories of vulnerability in the baseline study compared to the follow-up after administration of the care plan. This is indicated for Cross River and Lagos states, respectively.
| Cross River sample size=226 | Baseline number of households (%) | Follow‐up study number of households (%) |
| Most vulnerable | 2 (0.88) | 0 (0) |
| More vulnerable | 174 (76.99) | 120 (53.09) |
| Vulnerable | 50 (22.12) | 106 (46.90) |
| Lagos state sample size=180 | Baseline number of households (%) | Follow‐up study number of households (%) |
| Most vulnerable | 7 (3.88) | 1 (0.55) |
| More vulnerable | 142 (78.88) | 81 (45.00) |
| Vulnerable | 31 (17.22) | 98 (54.44) |
The gender distribution of respondents from the various study communities in Cross River State showed a total of 103 males (45.57%) and 95 females (54.42%), making a total of 198 respondents. In Lagos, 47% (85) of the respondents were males, while 53% (95) were females. The total number of households in Lagos state was 180.
Vulnerability Status of the Different Communities in Cross River
Figure 2 illustrates the vulnerability status of the different communities in Cross River State, presenting the baseline results for the three categories of vulnerability and those of the follow-up.
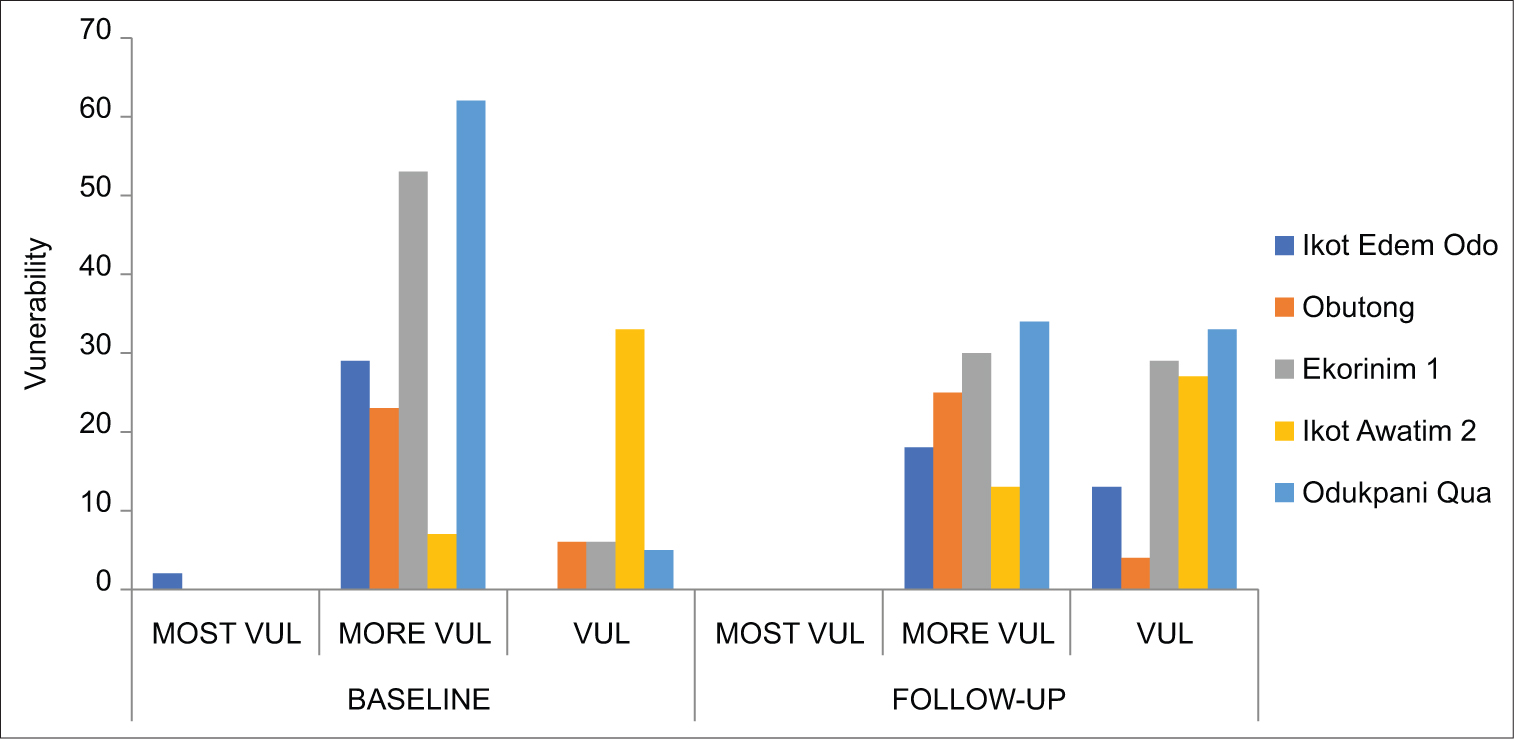
- Baseline and follow-up vulnerability of communities in Cross River.
Vulnerability Status of the Different Communities in Lagos State
Figure 3 shows the vulnerability status of the different communities in Lagos State, indicating the baseline results for the three different categories of vulnerability and those of the current study.
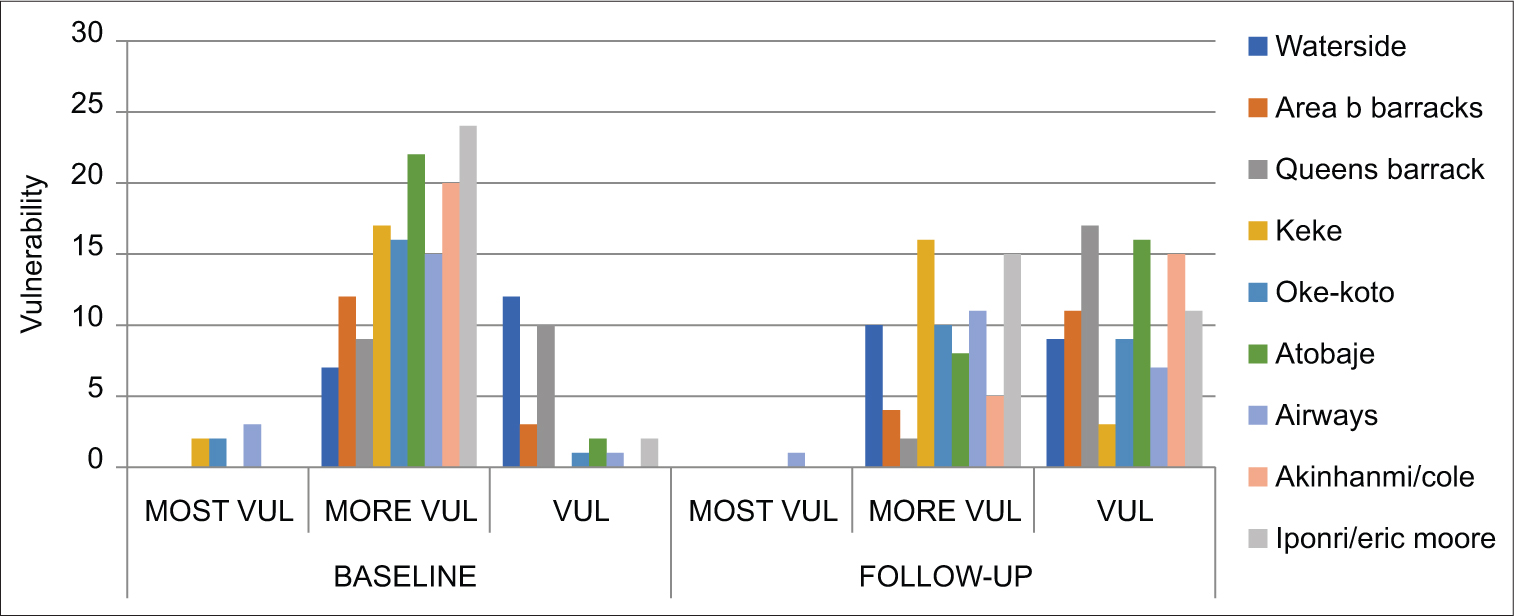
- Baseline and follow-up vulnerability of communities in Lagos.
DISCUSSION
The findings of the study shows the significant role care plan can play in reducing the level of vulnerability of households in Lagos and Cross River State. It has contributed immensely to the improvement of health, provision of shelter, food security, household income, means of livelihood, educational level, and general poverty reduction.
The findings of this investigation revealed that out of a total of 14 communities used for the study, 13 communities were significantly impacted by the care plan, while only one community, Waterside in the Apapa Local Government area, remained unaffected during the study period. This may be as a result of poor service delivery and access to the community, given that it was a riverine community. Poor implementation and service delivery have been reported by Brean et al.[15] to hinder the effectiveness of care plans designed for vulnerable households and individuals, leading to poorer health and social outcomes.
All communities covered in Calabar were positively impacted. Ikot Edem Odo in Akpabuyo had the highest impact, followed by Odukpani Qua, Ikot Awatim 2, Ekorinim 1, and Obotong. In the Lagos region, highly impacted communities were Akinhanmi/Cole, Atobaje, Queens Barracks, and Oke-Koto. Communities that fell into the most vulnerable category in Calabar were the Ikot Edem Odo Community, while in Lagos, we had Keke, Oke-Koto, and Airways. These households needed urgent intervention to help them recover and meet their basic needs. The results of this study showed that many households classified as “More Vulnerable Category” during the baseline assessment improved to a “Vulnerable level,” except for the Obotong community in Calabar Local Government, where three households remained in the “More Vulnerable state.” This can be attributed to the fact that the service rendered by the implementing partner was not delivered to the target population appropriately, or the care plan was not properly documented.
It is evident that the care plan is carefully tailored to meet the needs of households following a thorough assessment. The application of care plans in helping vulnerable individuals recover has been reported by several authors. In health outcomes, the evidence of its effectiveness was reported by Boyd et al.,[15] who demonstrated that individualized care plans for chronically ill and low-income families led to reduced hospital readmissions and better medication adherence. Similarly, interventions targeting maternal-child health in vulnerable households saw marked improvements in the quality of life and efficiency of health care for older adults with multimorbidity.[16,17] In terms of social and economic well-being, the “Family-Centered Practice” model used in the UK and Australia integrates care plans with social support services. This model has shown success in enhancing housing stability, school attendance, and financial independence among at-risk families.[18,19] Care planning has been shown to improve the efficiency and responsiveness of service delivery. Studies have highlighted how inter-agency care planning reduces duplication of services, improves accountability, and helps clients navigate complex systems.[20,21] Despite the benefits of care plan, it’s implemention faces challenges and limitations, including lack of funding, insufficient staffing, poor inter-agency collaboration, inadequate training of care coordinators, resistance from clients due to stigma or a lack of trust and a “ one-size-fits-all” care plan template that fails to consider cultural, linguistic or contextual differences.[22]
The effectiveness of the care plan is also dependent on the knowledge and the ability of the community volunteers or case managers conducting the HHVA. Studies have shown that well-trained case managers with cultural competencies and community knowledge are more likely to produce accurate assessments and develop realistic, client-centered care plans.[20,23] Conversely, poorly trained assessors may overlook critical household vulnerabilities or fail to build trust with families – leading to fragmented or inappropriate care.[24] It depends on the assessor’s ability and personal experience in asking the appropriate questions in a way that household members can understand and provide the right answers. Hence, continuous professional development, supportive supervision, and standardized HHVA tools can help to improve the consistency and reliability of care planning across various settings.[25-27]
CONCLUSION AND IMPLICATIONS FOR TRANSLATION
Care plans are an essential delivery service tool that optimizes the welfare of vulnerable households through coordinated coordination, empowerment, and service integration. This study examines the effectiveness of care plan in improving the vulnerability status of Cross River and Lagos States households in Nigeria. As strong as the evidence justifies their effectiveness, challenges still exist, and adaptive strategies, adequate training, and client-centered delivery are needed. Further research needs to focus on digital innovations, cost-effectiveness, and culture-adapted models of care planning.
Key Messages
(1) This study has demonstrated that care plans significantly improved the well-being of vulnerable households in Lagos and Cross States in the program. (2) Most of the program communities demonstrated a measurable reduction in household vulnerability, with households transitioning from the “Most vulnerable” and “More vulnerable” categories at baseline to less severe levels after the follow-up assessment. (3) This research has important implications for the use of care plans for vulnerable populations.
Acknowledgments:
We gratefully acknowledge the United States Agency for International Development (USAID) for funding the intervention and supporting efforts to improve the well-being of vulnerable households in Nigeria under the Systems Transformed for Empowered Actions and Enabling Responses (STEER) for Orphans and Vulnerable Children program.
We also extend our sincere appreciation to Save the Children International (SCI) for their leadership in implementing the STEER program and for providing access to program data.
COMPLIANCE WITH ETHICAL STANDARDS
Conflicts of Interest: The authors declare no competing interests. Financial Disclosure: Not applicable. Funding/ Support: This study was funded by the United States Agency for International Development (USAID), under Cooperative Agreement Number AID-620-A-13-00002. Ethics Approval: Ethical approval was obtained from the ethical committee of the Ministry of Health in the respective States. Declaration of Patient Consent: Consent was also obtained from households during their enrolment in the project. The authors certify that they have obtained all appropriate consent. Confidentiality and privacy of households were protected and maintained in accordance with the Helsinki Declaration. Use of Artificial Intelligence (AI)‑Assisted Technology for Manuscript Preparation: The authors confirm that artificial intelligence (AI)-assisted technology was not used in the preparation of the manuscript, and no images were manipulated using AI. Disclaimer: None.
REFERENCES
- , Luckey DW, Knudtson MD, Robinson J. Effects of Home Visits by Paraprofessionals and by Nurses on Children: Follow-Up of a Randomised Trial at Ages 6 and 9 Years.JAMA Paediatr 2014;168:114-21.
- [CrossRef] [PubMed] [Google Scholar]
- Evaluation of the Processes of Family-Centred Care for Young Children with Intellectual Disability in Western Australia.Child Care Health Dev 2010;36:709-18.
- [CrossRef] [PubMed] [Google Scholar]
- The Role of Evidence, Context, and Facilitation in an Implementation Trial: Implications for the Development of the PARIHS Framework.Implement Sci 2013;8:28.
- [CrossRef] [PubMed] [Google Scholar]
- , Lohrmann C, Schoberer D. The Effectiveness of Cultural Competence Interventions in Nursing: A Systematic Review and Meta-Analysis.Int J Nurs Stud 2025:105079.
- [CrossRef] [PubMed] [Google Scholar]
- Supervision of Community Health Workers in Low-Income Countries - A Review of Practical Approaches and A Conceptual Framework.Health Policy Plan 2020;35:286-99.
- [Google Scholar]