Network Pharmacology and Preliminary In-Vitro Evaluation of Piper Longum (Indian Long Pepper) in Breast Cancer

*Joint corresponding authors.
*Corresponding authors: Shivam Singh, Vitthal Govindappa Huddar, Subhash Gupta shivam10singh2020@gmail.com drvghuddar@gmail.com drsubhashgupta72@gmail.com All India Institute of Medical Sciences, New Delhi, India
-
Received: ,
Accepted: ,
ABSTRACT
Background and Objectives
Piper longum (Indian Long Pepper) contains phytochemicals reported to have anticancer activity, but their targets and effects in breast-cancer models remain uncertain. This exploratory study combined network pharmacology, analysis of public breast cancer data, molecular docking, MCF-7 viability, DNA cell cycle, and apoptosis assays.
Methods
Nineteen compounds from P. longum fruit were identified using the literature and phytochemical databases. Target prediction tools and cancer gene databases were used to identify interactions with breast cancer genes. Protein–protein interaction, gene ontology, and pathway analyses highlighted key targets. Molecular docking was used to evaluate binding affinities, and in vitro assays assessed cytotoxicity in MCF-7 breast cancer cells.
Results
This study revealed 600 common gene targets between P. longum compounds and breast cancer. Compound-target-disease network analysis prioritized Norcepharadione B, Aristolodione, Pellitorine, Aristolactam AII, and N-isobutyl decadienamide as candidate compounds. Significant breast cancer genes (TP53, CTNNB1, STAT3, SMAD3, EGFR, and HSP90AA1) were central to these interactions. Notably, HSP90AA1 showed the most favorable predicted docking scores with Norcepharadione B and Aristolactam AII. Additionally, the aqueous extract of P. longum significantly inhibited the MCF-7 MTT signal, with an IC50 of 3.75 µg/mL.
Conclusion and Implications for Translation
In this study, Piper longum phytochemicals were linked to key cancer genes. Molecular docking of the top five compounds with six genes showed that Norcepharadione B had the strongest affinity for HSP90AA1, indicating its potential to modulate HSP90AA1-mediated pathways, including ER and HER2 signaling. These interactions suggest therapeutic relevance. Furthermore, aqueous P. longum extract inhibited MCF-7 cellular metabolism at the IC₅₀ dose, possibly through cell-cycle arrest or apoptosis, which is currently under further investigation in our laboratory. These findings support further testing of defined P. longum compounds in breast-cancer models, but they do not yet establish therapeutic activity or mechanism.
Keywords
Breast Cancer
Piper Longum
Network Pharmacology
Molecular Docking
Cell Proliferation
INTRODUCTION
Background
Breast cancer continues to be a significant challenge in global health, as its complex development and varied clinical presentations pose substantial difficulties for effective treatment and prevention.[1] With the worldwide occurrence of this disease on the rise, it is crucial to explore the intricate nature of breast cancer to create successful therapeutic approaches.[2]
Network pharmacology is widely used to prioritize compound-target relationships in complex mixtures, although its predictions require experimental validation. Unlike conventional single-target approaches, it enables the identification of multi-target mechanisms underlying the therapeutic effects of complex herbal medicines. In the present study, network pharmacology was employed to predict the potential molecular targets and biological pathways through which Piper longum phytochemicals may exert anti-breast cancer activity.
Piper longum (Indian long pepper) is a medicinal plant of the family Piperaceae that has long been used in traditional medicine and has attracted increasing attention for its anticancer potential.[3] Experimental studies have shown that P. longum extracts and several of its bioactive constituents, including piperine and piperlongumine, inhibit breast cancer cell proliferation through mechanisms involving apoptosis, cell-cycle arrest, oxidative stress, and modulation of multiple oncogenic signaling pathways.[4,5] However, the comprehensive molecular targets and interconnected signaling networks through which the diverse phytochemicals of P. longum exert their anti-breast cancer effects remain poorly understood. Therefore, this study used an integrated network pharmacology, molecular docking, and experimental approach to systematically identify the anti-breast cancer activity of P. longum.
Objectives
This study used network analysis to prioritize P. longum phytochemicals and breast-cancer-associated targets for further testing. The process involved several key steps, including gathering and organizing data on the chemical compounds present in P. longum, constructing a network using analytical methods, identifying key nodes through network analysis, computationally predicting results using molecular docking, and interpreting the findings to predict potential drug targets and therapeutic uses. In addition, the effect of P. longum aqueous extract on cancer cell proliferation was also assessed in the MCF-7 breast cancer cell line.
Aim
The study aimed to investigate different compounds found in P. longum as potential phytochemicals against breast cancer and to explore the effect of the aqueous extract of P. longum fruits on breast cancer cell proliferation.
METHODS
P. longum Bioactive Compounds Identification
Bioactive phytochemical constituents reported from the fruits of Piper longum were compiled using two independent sources: (i) the Indian Medicinal Plants, Phytochemistry and Therapeutics (IMPPAT) database (https://cb.imsc.res.in/imppat/; accessed on 25 April 2025), and (ii) a systematic literature survey of published phytochemical studies.[6] The IMPPAT database was searched using the keyword “Piper longum” under the medicinal plant search option. All phytochemicals specifically annotated for the fruit of P. longum were retrieved. Literature searches were performed using combinations of the keywords “Piper longum,” “fruit,” “phytochemical,” “constituents,” “secondary metabolites,” and “chemical composition.”
The lists obtained from both sources were merged, and duplicate compounds were removed using compound names and PubChem Compound Identifiers (CID). Only compounds with a defined chemical structure and an available PubChem entry were retained for further analysis. Canonical SMILES and molecular structures were downloaded from PubChem and used as input for subsequent analyses (https://pubchem.ncbi.nlm.nih.gov/).[7] All databases were accessed during 2024.
Screening of Potential Bioactive Compounds Using Absorption, Distribution, Metabolism, and Excretion (ADME) Analysis
The collected phytochemical compounds were subjected to pharmacokinetic evaluation using the SwissADME web server (http://www.swissadme.ch/) to assess their drug-likeness and suitability for oral administration.[8] The canonical SMILES notation for each compound, obtained from the PubChem database, was uploaded to the SwissADME server for analysis. Several physicochemical and pharmacokinetic parameters relevant to drug discovery were evaluated, including molecular weight, hydrogen bond donor and acceptor counts, topological polar surface area (TPSA), XLOGP3 (octanol/water partition coefficient), predicted gastrointestinal (GI) absorption, Lipinski’s Rule of Five compliance, and the predicted bioavailability score.[4,9] These parameters were selected to assess the oral drug-likeness, pharmacokinetic behavior, and medicinal chemistry suitability of each phytochemical.
Compounds were screened using predefined inclusion criteria to select candidates with favorable pharmacokinetic properties. Only compounds with complete physicochemical information in SwissADME, a canonical chemical structure available in the PubChem database, no violations of Lipinski’s Rule of Five, a predicted bioavailability score ≥ 0.30, and acceptable GI absorption were considered eligible for further analysis. The Lipinski rule is based on specific physicochemical properties, such as absorption, distribution, metabolism, and excretion, to predict drug pharmacokinetic properties such as (1) a maximum of five hydrogen bond donors, (2) a maximum of 10 hydrogen bond acceptors, (3) a molecular mass less than 500 Da, and (4) the partition coefficient, or XLOGP3, must not exceed 5 (Supplementary Table 2). The partition coefficient quantifies the relationship between a compound’s lipophilicity (fat solubility) and hydrophilicity (water solubility). A compound with XLOGP3 > 5 is considered excessively lipophilic. Such compounds often suffer from several pharmacokinetic problems, including poor aqueous solubility in fluids such as GI fluids, reduced intestinal absorption, excessive tissue accumulation, and more. Conversely, compounds were excluded if they lacked complete structural or physicochemical information, were unavailable in the PubChem database, violated one or more of Lipinski’s criteria, exhibited poor predicted GI absorption, or had a predicted bioavailability score below 0.30 because in early drug discovery, compounds with a bioavailability score of ≥0.3 are generally considered acceptable, whereas values >0.5 are preferred for improved therapeutic efficacy and dose optimization.[10] After applying these screening criteria, 19 phytochemical compounds were identified as potential bioactive constituents of Piper longum and were subsequently selected for downstream target prediction and network pharmacology analyses. Supplementary Figure 1 shows a brief flow diagram of the screening pipeline.
P. longum Potential Targets Prediction
The potential human protein targets of the 19 phytochemicals that passed the predefined ADME and drug-likeness criteria were predicted using three complementary in silico platforms: SuperPred (https://prediction.charite.de/; accessed on 10th May 2025), SwissTargetPrediction (http://www.swisstargetprediction.ch/; accessed on 10th May 2025), and DIGEP-Pred (http://www.way2drug.com/ge/; accessed on 10th May 2025).[11–13] Canonical SMILES structures obtained from PubChem were used as input for target prediction. Targets meeting the predefined confidence criteria were retained for subsequent analysis. Specifically, predicted targets with a probability score >0.80 in SuperPred, >0.40 in SwissTargetPrediction, and >0.50 in DIGEP-Pred were selected.[14] The search was restricted to Homo sapiens targets. Predicted target names, UniProt identifiers, gene symbols, and probability scores were retrieved. Duplicate targets predicted for multiple compounds were merged before downstream analyses. The resulting target lists from the three platforms were integrated to generate a comprehensive set of candidate targets associated with the selected P. longum phytochemicals. These targets represent computational predictions and database-derived associations and were not considered experimentally validated molecular targets.
Breast Cancer Screening Targets
Breast cancer-associated genes were retrieved from the Online Mendelian Inheritance in Man (OMIM) (https://www.omim.org/; accessed on 12th May 2025), Therapeutic Target Database (TTD) (https://db.idrblab.net/ttd/; accessed on 12th May 2025), and GeneCards (https://www.genecards.org/; accessed on 13th May 2025) (with a relevance score exceeding 30) using the keyword “Breast Cancer.”[15–17] The predefined database-specific criteria for human protein-coding genes were applied. Database-specific inclusion criteria were applied, gene symbols were standardized, and duplicate entries were removed. The resulting disease-associated gene set was then compared with the predicted phytochemical target set to identify shared candidate targets.
Shared Target Identification
The predicted P. longum phytochemical targets and breast cancer-associated genes were compared using Venny version 2.1.0 (https://bioinfogp.cnb.csic.es/tools/venny/; on 15th May 2025). The overlapping genes were considered shared candidate targets linking the selected phytochemicals with breast cancer. They were subsequently subjected to PPI-network construction, enrichment analysis, compound–target–disease network analysis, and molecular docking.
Construction and Analysis of Protein–Protein Interaction (PPI) Network
Protein-protein interactions (PPIs) play a crucial role in regulating cellular activities and biological functions across different organisms. Gaining insights into protein interactions can enhance our understanding of infection mechanisms and inform the development of effective drugs and treatment strategies. A PPI network was constructed using the STRING database (https://string-db.org/; 16th May 2025), focusing on Homo sapiens genes with high-confidence interaction scores of ≥0.7, with disconnected nodes hidden.[18] Next, network data from the STRING database were exported as a tab-separated values file to build the PPI network diagram and perform enrichment analysis using Cytoscape v3.9.1.[19] Network topology was analyzed using the CytoNCA plugin by calculating Degree Centrality (DC), Betweenness Centrality (BC), and Closeness Centrality (CC) for each node. Degree centrality was used to identify highly connected proteins, while betweenness and closeness centrality were used to evaluate each node’s relative influence and connectivity within the network.
Construction and Analysis of Compound, Target, and Disease (C-T-D) Network
A C-T-D network was developed using Cytoscape v3.9.1 (https://cytoscape.org/) to visualize interactions among the selected phytochemicals, predicted target genes, and breast cancer. We extracted nodes representing core genes, drugs, and diseases. By analyzing the nodes, we identified several targets based on their connectivity degree, which reflects their importance. We used the CytoNCA plugin to perform network topology analysis and loaded the C-T-D network map into Cytoscape version 3.9.1. Nodes were ranked by degree centrality. Degree was used as a network prioritization measure, not to test statistical significance.[20] Nodes with higher degree values were considered more influential within the network, and the top-ranked phytochemicals were identified based on their connectivity to predicted target genes.
Gene Ontology (GO) Analysis for Enrichment and Pathway Analysis
ShinyGO 0.7 (http://bioinformatics.sdstate.edu/go/; accessed on 20th May 2025) was utilized for the analysis of pathway and process enrichment.[21] This tool encompasses a standard collection of ontologies for enrichment analysis, including Gene Ontology (GO) processes, Kyoto Encyclopedia of Genes and Genomes (KEGG) pathways, Reactome gene sets, canonical pathways, and a thorough resource for mammalian protein complexes. GO and KEGG enrichment analyses were performed on the 23 top-ranked genes selected from the PPI network.[22]
Analysis of Gene Expression
Gene expression analysis was performed using the Gene Expression Profiling Interactive Analysis 2 (GEPIA2, http://gepia.cancer-pku.cn/; accessed on 22nd May 2025), which integrates RNA-sequencing data from The Cancer Genome Atlas (TCGA) and the Genotype-Tissue Expression (GTEx) projects.[23] Breast Invasive Carcinoma (BRCA) tumor samples were compared with normal breast tissues using the GEPIA2 “Expression DIY” module. The differential expression cut-off parameters were set to |log2FC| ≥ 1 and p < 0.01, consistent with previous reports.[24] At the time of analysis, the BRCA dataset comprised 1,085 tumor samples and 291 normal samples (TCGA and GTEx combined). Differential expression analysis was performed using the statistical methods implemented in the GEPIA2 platform. GEPIA2 uses ANOVA for differential expression between tumor and normal tissues and the log-rank test for survival analysis.
Analysis of Overall Survival and Heat Map of Survival
Overall survival analysis of the six hub genes was performed using the GEPIA2 survival module with the default parameters.[25] Patients were automatically divided into high- and low-expression groups according to the default GEPIA2 expression cut-off (median expression), and survival differences were evaluated using Kaplan–Meier survival curves and the log-rank test. The GEPIA2 server generated hazard ratios with 95% confidence intervals. Because survival analysis was performed only for six predefined hub genes identified through the network analysis, no additional multiple-testing correction was applied.
Molecular Docking
The PDB structural data of the six hub genes were obtained from the Protein Data Bank (PDB) (https://www.rcsb.org/; accessed on 25th May 2025).[26] The PyMOL Molecular Graphics System, Version 2.3.2, developed by Schrödinger, LLC (http://www.pymol.org/pymol), was then used to view the downloaded target structure files in .pdb format.[27] Using PyMOL, water molecules and other heteroatoms, such as Ca, Cl, and Na, were removed from the structures before energy minimization. Then, using PubChem (https://pubchem.ncbi.nlm.nih.gov/), the top five bioactive compounds (ligands) from P. longum were converted into their corresponding 3D conformations in the .sdf file format.[2] Subsequently, the target molecules in .pdb format and ligand molecules in .sdf format were loaded into the cavity-detection guided blind docking program CB-Dock2 (http://cadd.labshare.cn/cb-dock2/; accessed on 25th May 2025).[28] CB-Dock2 automatically identifies potential ligand-binding cavities within the protein structure and ranks the predicted cavities according to their size. Based on the predicted cavities, the docking center and docking box dimensions are automatically determined according to the ligand structure. Molecular docking is subsequently performed using AutoDock Vina (https://github.com/ccsb-scripps/AutoDock-Vina). The resulting ligand-binding poses are ranked according to their predicted Vina scores, expressed in kcal/mol. These values represent the predicted binding affinity/docking scores of the corresponding protein–ligand complexes, with more negative values indicating a more favorable predicted interaction.
The top-ranked conformation for each protein–ligand complex was considered the optimal predicted binding pose. Finally, 2D schematic representations of predicted protein-ligand interactions were further visualized using two-dimensional interaction diagrams generated with the LIGPLOT tool (https://www.ebi.ac.uk/thornton-srv/software/LigPlus/; accessed on 25th May 2025) with standard Protein Data Bank file input.[29] The result is a PostScript file, in color or black and white, that identifies hydrogen bonds, hydrogen-bond distances, interacting amino acid residues, and hydrophobic contacts between the ligands and the respective target proteins.
Extract Preparation
Dried fruits of Piper longum Linn. were procured from the pharmacy of the All India Institute of Ayurveda (AIIA), New Delhi, India. The plant material was authenticated in the Department of Dravyaguna, AIIA, before use in accordance with institutional quality-control procedures and the standards of the Ayurvedic Pharmacopoeia of India. The fruits were thoroughly washed with distilled water to remove adhering dust, foreign particles, and damaged plant material, then shade-dried at ambient temperature for approximately 20 days until a constant weight was achieved. The dried fruits were then pulverized into a coarse powder using an electric grinder and stored in airtight containers under dry conditions until extraction.
To compare different extraction approaches, aqueous and hydroalcoholic extracts were prepared using both cold maceration and Soxhlet extraction techniques at the Department of Rog Nidan and Vikriti Vigyan, AIIA. For cold maceration, 400 g of the powdered fruit material was suspended in 5 L of sterile double-distilled water (solid-to-solvent ratio, 1:12.5 w/v) and continuously stirred at room temperature (25 ± 2°C) for 12 hours to facilitate efficient extraction of water-soluble phytoconstituents. The extract was subsequently filtered through Whatman No. 1 filter paper to remove insoluble plant debris.
For Soxhlet extraction, coarsely powdered P. longum fruits were extracted separately with distilled water and a hydroalcoholic solvent (water, 1:1, v/v) until the extraction solvent in the siphon tube became colorless, indicating exhaustive extraction of soluble constituents. The resulting extracts were filtered through Whatman No. 1 filter paper to remove particulate matter.
The filtrates from all extraction methods were concentrated by evaporation in a hot-air oven at 55°C for 24 hours until a semisolid crude extract was obtained. The dried extracts were transferred to sterile airtight containers and stored at 4°C until further use. The extraction yield percentage was calculated as follows:
The extraction yields are given in (Supplementary Table 1).
HIGH PERFORMANCE THIN LAYER CHROMATOGRAPHY (HPTLC)
Piperine is one of the most abundant and essential alkaloids found in the Piperaceae family, such as P. longum and P. nigrum. Therefore, the selected extracts were chemically standardized by HPTLC using piperine as the reference marker before biological evaluation. A simple, rapid, quantitative HPTLC technique was used to validate the presence of piperine in various P. longum extracts mentioned above, following the HPTLC Association protocol for P. longum (www.hptlc-association.org). Briefly, 1 mg of test samples (cold maceration aqueous extract, aqueous, and hydro-alcoholic extracts by the Soxhlet method) was dissolved in 1 mL of methanol. Similarly, 1 g of dried fruit powder was dissolved in 10 mL of methanol, and 0.9 mg of standard piperine (Sigma-Aldrich, USA) was dissolved in 1 mL of methanol. Each standard and extract solution was sonicated for 10 minutes. The plate was prepared according to the HPTLC software. A mobile phase comprising Cyclohexane: Ethyl acetate (5:3 v/v) was prepared, and 20 mL of it was added to the chromatographic glass chamber. Two saturation pads were placed in the chamber for 20 minutes. Meanwhile, 7 µL of test samples and 3 µL of serially diluted piperine standard solutions were applied to pre-coated HPTLC Si 60 F254 (Merck) plates. After loading and saturation, the silica gel plate was placed in the mobile phase to allow the samples to develop in the solvent. Following absorption, the plate was air-dried. The underivatized plate was viewed under UV light at 254 nm and 366 nm to compare piperine bands in test samples with standards. Piperine detection was also performed after derivatization.
Cell Culture
The human breast adenocarcinoma cell line MCF-7, obtained from the National Center for Cell Science (NCCS), Pune, India, was maintained in Dulbecco’s Modified Eagle Medium (DMEM) supplemented with 10% heat-inactivated fetal bovine serum (FBS), 100 U/mL penicillin, and 100 μg/mL streptomycin. Cells were cultured in a humidified incubator at 37°C with 5% CO₂ and 95% air. The culture medium was replaced every 2–3 days, and cells were passaged at approximately 70–80% confluency using 0.25% trypsin–EDTA. Cell viability was routinely assessed by the trypan blue exclusion assay, and only cultures with>95% viability and no visible contamination were used for experiments. For treatment studies, cells were seeded at the required density and allowed to adhere for 24 hours before exposure to the test extracts.
Preparation of Extract Dilutions
A stock solution of the aqueous P. longum extract was prepared at 1 mg/mL in phosphate-buffered saline (pH 7.4) and filter-sterilized before use. Immediately before each experiment, serial working dilutions were freshly prepared from the stock solution using complete culture medium to obtain final treatment concentrations of 0.25, 0.5, 1.0, 2.5, 3.75, 5.0, 7.5, 10, 12.5, 15, 20, 25, 30, and 50 µg/mL. Cells treated with complete culture medium alone served as the untreated control.
MTT Assay
The cytotoxic effect of Piper longum aqueous extract on MCF-7 human breast cancer cells was evaluated using the 3-(4,5-dimethylthiazol-2-yl)-2,5-diphenyltetrazolium bromide (MTT) assay. Briefly, 1 × 10⁴ MCF-7 cells were seeded into 96-well flat-bottom tissue culture plates at an appropriate density and allowed to attach overnight under standard culture conditions. The next day, the culture medium was replaced with fresh complete medium containing different concentrations of P. longum aqueous extract. Untreated cells maintained in complete culture medium served as the negative control.
After 24 hours of treatment, 20 μL of MTT solution (5 mg/mL prepared in phosphate-buffered saline) was added to each well, followed by incubation for an additional 4 hours at 37°C in a humidified atmosphere containing 5% CO₂. During this period, metabolically active cells reduced the yellow tetrazolium salt to insoluble purple formazan crystals. At the end of the incubation period, the culture medium containing excess MTT reagent was carefully aspirated without disturbing the crystals, and 100 μL of dimethyl sulfoxide (DMSO) was added to each well to completely dissolve the formazan crystals. The plates were gently agitated for 10–15 minutes to ensure complete solubilization before measuring the absorbance at 570 nm using a microplate reader. Cell viability was expressed as the percentage of viable cells relative to the untreated control using the following equation:
The concentration of P. longum aqueous extract required to inhibit 50% of cell viability (IC₅₀) was determined from the dose-response curve in GraphPad Prism version 10. Each concentration was tested in [number] technical wells in each of [number] independent experiments. Data are presented as mean ± SD.
Statistical Analysis
All experiments were performed in three independent biological replicates, with each treatment and control analyzed in triplicate wells. Data are expressed as the mean ± standard deviation (SD). Statistical analyses were performed using GraphPad Prism version 10.0 (GraphPad Software, San Diego, CA, USA). The half-maximal inhibitory concentration (IC₅₀) of P. longum aqueous extract was determined by nonlinear regression analysis using a log(inhibitor) vs. normalized response (variable slope) dose-response curve model. A p-value of <0.05 was considered statistically significant.
RESULTS
P. longum Active Compounds
Literature review and IMPPAT database searches identified 82 bioactive compounds in P. longum fruit (Supplementary Table 2). All compounds were evaluated using SwissADME analysis to assess drug-likeness based on bioavailability score ≥0.3 and Lipinski’s rule of five, which is used to predict the drug pharmacokinetic properties based on the facts such as (1) a maximum of five hydrogen bond donors, (2) a maximum of 10 hydrogen bond acceptors, (3) a molecular mass less than 500 Da, and (4) the partition coefficient, or XLOGP3, must not exceed 5 (Supplementary Table 3). This screening yielded 19 promising ligands (Supplementary Table 2). The selected compounds had calculated molecular weights of approximately 222-370 Da and XLOGP3 values of 1.23–4.70. Predicted GI absorption and blood-brain barrier penetration have also been reported separately for each compound in Supplementary Table 3. Additionally, most compounds were not P-glycoprotein (PGP) substrates, suggesting reduced efflux and enhanced bioavailability and reinforcing their potential as effective therapeutic candidates.
Breast Cancer and P. longum Potential Targets
Following the ADME analysis, the bioactive compounds underwent target prediction using the SuperPred, SwissTargetPrediction, and DIGEP-Pred databases, yielding 11,812 predicted targets. A thorough search using the keyword “Breast Cancer” in OMIM, the TTD, and GeneCards identified 954 target genes. After reviewing the target genes linked to P. longum and breast cancer, we found an overlap of 600 targets, as shown in Figure 1b and listed in Supplementary Table 4.
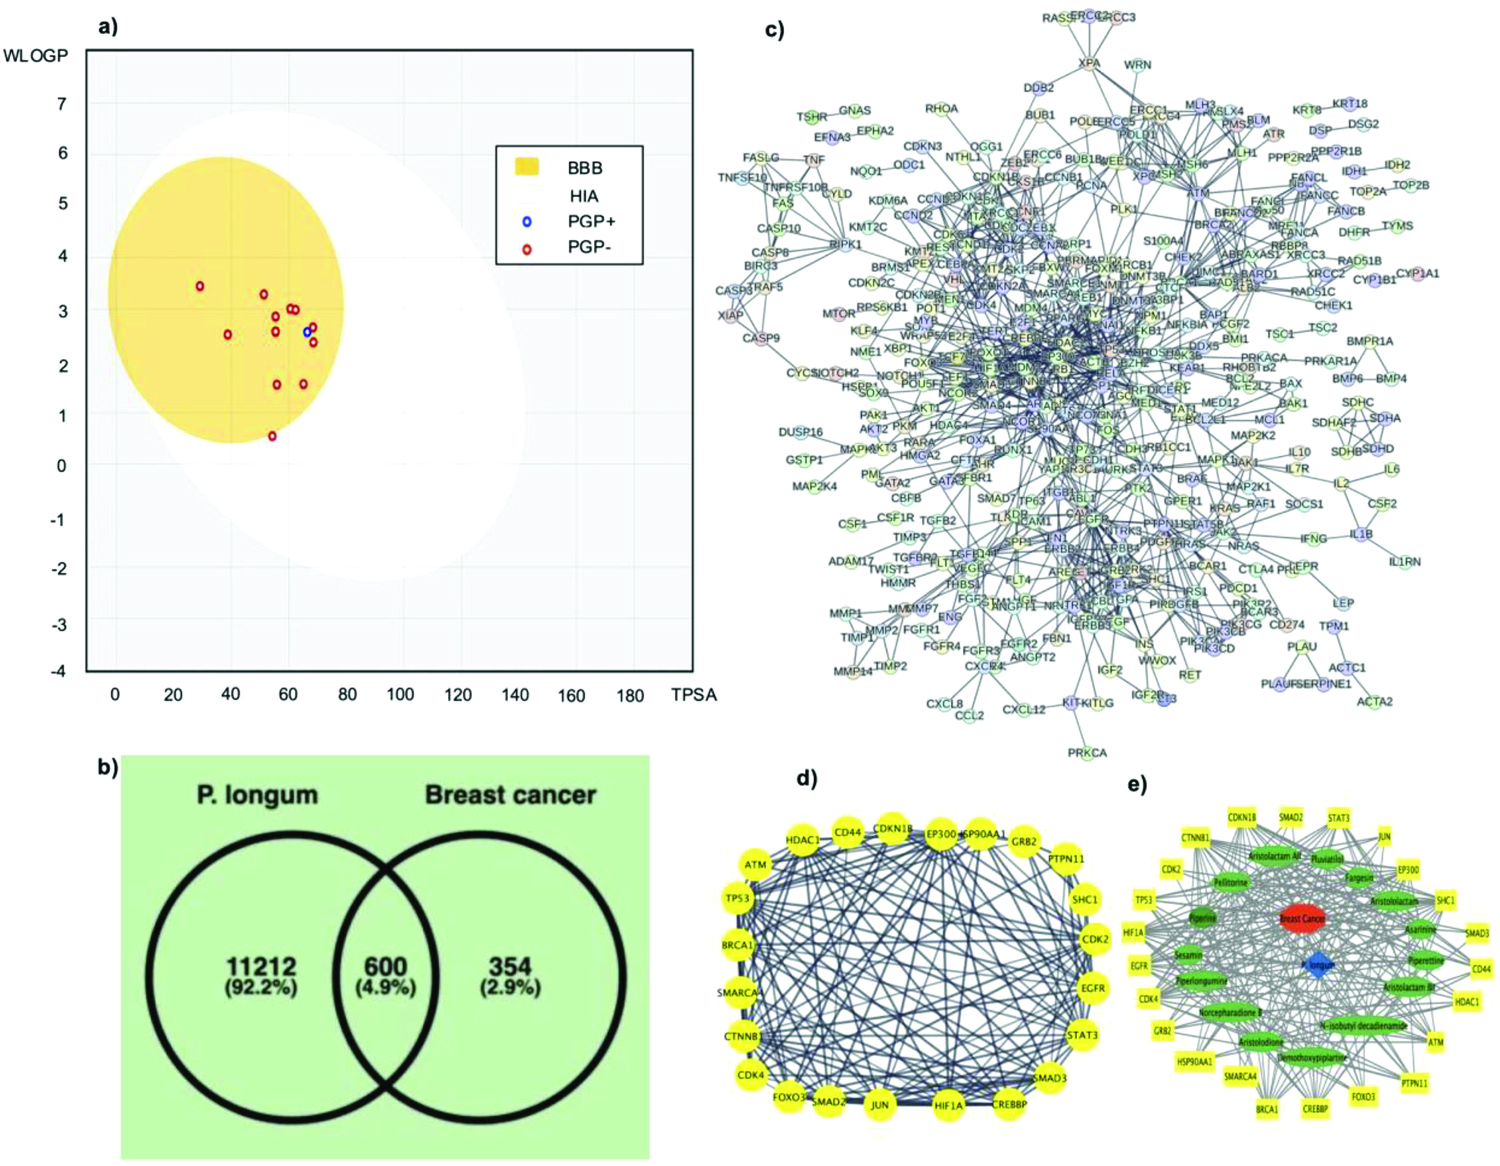
- (a) Predicted BOILED-Egg diagram of the selected compounds. BBB - Blood Brain Barrier, HIA - Human Intestinal Absorption, PGP+ - substrate of P-glycoprotein and PGP- - non-substrate of P-glycoprotein. (b) Intersecting targets between the active phytochemical potential protein targets in P. longum and Breast cancer-related genes. (c) The PPI network of the 600 intersecting targets, (d) The PPI network of the top 23 target genes, and (e) Compound – Target – Disease network of breast cancer and P. longum.
Protein–Protein Interaction (PPI) Network
Of the 600 overlapping targets, 516 were included in the STRING interaction network under the predefined high-confidence interaction threshold, whereas the remaining targets were excluded because they lacked qualifying interactions. To refine the analysis, we ranked nodes by degree and generated a focused PPI network of the top 23 genes using Cytoscape (Figure 1d). These genes included TP53, CTNNB1, STAT3, EP300, BRCA1, JUN, HDAC1, SMAD3, FOXO3, EGFR, HIF1A, CREBBP, HSP90AA1, CDK2, SMAD2, CDK4, SMARCA4, ATM, GRB2, CDKN1B, PTPN11, CD44, and SHC1.
The refined network consisted of 23 nodes and 139 edges, with an average of 12.1 neighbors per node. Degree centrality (DC), betweenness centrality (BC), and closeness centrality (CC) values are provided in Supplementary Table 5. DC quantifies the total number of direct connections a node possesses. DC reflects the number of direct connections, BC indicates a node’s role in shortest paths, and CC measures proximity to all nodes.[30] Six genes—TP53, CTNNB1, STAT3, SMAD3, EGFR, and HSP90AA1—showed above-average DC, BC, and CC, identifying them as hub genes (Supplementary Table 5). The network hierarchy for hub gene selection is as follows:
600 overlapping targets → 516 STRING-network nodes → Cytoscape → CytoNCA → Degree, Betweenness Centrality (BC), and Closeness Centrality (CC) → 23 top-ranked network genes → 6 final hub genes.
Construction and Analysis of C-T-D Network
The Cytoscape application was used to create a compound-target-disease network, enabling exploration of the complex interactions among compounds, targets, and breast cancer. Figure 1e depicts the C-T-D network, which encompasses 200 nodes and 400 edges, with an average of 4 neighboring nodes. Supplementary Table 6 presents the degree, betweenness, and closeness centralities for the top 15 bioactive compounds associated with breast cancer. The five compounds with the highest degree centrality were Pellitorine (20), Aristolodione (18), Aristolactam AII (18), Norcepharadione B (16), and N-isobutyl decadienamide (15).
Gene Ontology (GO) Enrichment and KEGG Pathway Analysis
Targets of P. longum were analyzed using functional annotation and enrichment analyses, revealing key biological roles associated with its phytochemicals. Gene Ontology (GO) and KEGG enrichment analyses were performed on the 23 top-ranked genes selected from the PPI network. Gene Ontology (GO) analysis showed involvement in biological processes (BP) such as responses to growth factors, regulation of signal transduction, and responses to chemical and oxygen-containing stimuli. Cellular components (CC) included SMAD complexes, cyclin-dependent kinase complexes, transcription repressor complexes, euchromatin, DNA repair complexes, and chromosomes. Molecular functions (MF) comprised p53 binding, transcription coactivator binding, kinase and phosphatase binding, and transcription regulation. Using an FDR cutoff of 0.05, 631 BP, 19 CC, and 74 MF terms were identified across 23 genes (Supplementary Figure 2). KEGG pathway analysis revealed 101 associated pathways, including cancer-related pathways, breast cancer, chronic myeloid leukemia, microRNAs in cancer, Forkhead box O (FOXO) signaling, PI3K-Akt signaling, cell cycle regulation, viral carcinogenesis, and hepatitis C. These findings highlight the therapeutic relevance of P. longum.
Unique Gene Expression
We assessed the expression levels of six breast cancer hub genes, including TP53, CTNNB1, STAT3, SMAD3, EGFR, and HSP90AA1, by comparing them with the BRCA dataset using the GEPIA2 web tool (Supplementary Figure 3). The Cancer Genome Atlas-BRCA (TCGA_BRCA) dataset comprises expression data from 1,085 tumor tissues and 291 corresponding normal tissues related to BRCA. In the box plot, tumor samples are represented in red, while normal samples are shown in grey. A red asterisk indicates a statistically significant p-value (below 0.01), implying a potentially important difference in gene expression between tumor and normal tissues. The y-axis represents the mean log2 (TPM + 1) values for gene expression levels. This transformation is commonly used in gene expression studies to stabilize variance across expression levels. At the stated cutoff, only EGFR and HSP90AA1 showed significant tumor-normal differences in the GEPIA2 analysis shown. HSP90AA1 was significantly upregulated and overexpressed in the TCGA_BRCA dataset. Additionally, TP53 was also overexpressed in the TCGA_BRCA dataset, but the difference was not significant (p > 0.05). In contrast, EGFR’s expression was significantly downregulated in this dataset. Moreover, STAT3 and SMAD3 expression was downregulated (p > 0.05) (Supplementary Figure 4). CTNNB1 showed a negligible change in expression in the TCGA_BRCA dataset (Supplementary Figure 3).
Heat Maps and Survival Analysis of Unique Genes
Using GEPIA2, a survival analysis was conducted by comparing gene expression levels identified in the survival heat map analysis with the TCGA_BRCA dataset (Supplementary Figure 4a). Among the six genes associated with breast cancer, HSP90AA1 and TP53 exhibited high expression levels in the BRCA dataset. Conversely, the remaining genes—CTNNB1, STAT3, SMAD3, and EGFR—demonstrated minimal expression in the BRCA dataset (Supplementary Figure 4a). A survival heatmap visually displays survival data, illustrating the relationship between specific variables (in this case, the six hub genes) and survival outcomes (such as overall survival time) across individuals or groups. The prognostic impact helps identify genes associated with improved or poorer survival, aiding the discovery of potential biomarkers for prognosis and treatment. Overall-survival analysis showed that the prognostic associations varied among the six hub genes. TP53 expression was significantly associated with poorer overall survival (HR = 1.4, p = 0.038), whereas the associations observed for HSP90AA1, CTNNB1, STAT3, SMAD3, and EGFR did not reach statistical significance under the analysis conditions used. Moreover, some genes exhibiting high expression levels and correlations with survival in BRCA patients included CTNNB1 (HR (Hazard ratio) = 0.94; p = 0.71), STAT3 (HR = 0.96; p = 0.82), SMAD3 (HR = 0.91; p = 0.58), and EGFR (HR = 0.9; p = 0.53). In contrast, the expression levels of TP53 (HR = 1.4, p = 0.038) and HSP90AA1 (HR = 1.3, p = 0.079) were associated with poorer prognoses and reduced survival rates among BRCA patients (Supplementary Figure 4b–g). The survival analysis suggested a potential association between higher TP53 expression and poorer overall survival (p = 0.038), whereas the association observed for HSP90AA1 was weaker and did not reach statistical significance. These findings should therefore be considered exploratory and require validation in independent cohorts (Supplementary Figure 4).
Molecular Docking and Visualization Analysis
Molecular docking was employed to predict the potential interactions between the selected P. longum phytochemicals and six breast cancer-associated hub proteins. The protein structures used for docking were obtained from the Protein Data Bank (PDB) and included 4MZI (TP53), 8Y0G (CTNNB1), 6NUQ (STAT3), 1MJS (SMAD3), 1M17 (EGFR), and 4BQG (HSP90AA1).[31–36] The predicted ligand docking score values for every hub gene are shown in Supplementary Table 7, in which the corresponding values, expressed in kcal/mol, represent the AutoDock Vina scores generated during the docking process and were used to rank the predicted binding poses. More negative Vina scores indicate more favorable predicted docking scores. Among the evaluated complexes, eleven protein–ligand interactions showed predicted binding affinities below −7 kcal/mol. These include HSP90AA1_Norcepharadione B (−10.9 kcal/mol), HSP90AA1_Aristolactam AII (−10.7 kcal/mol), HSP90AA1_Aristolodione (−10.3 kcal/mol), EGFR_Aristolodione (−9.1 kcal/mol), HSP90AA1_N-isobutyl decadienamide (−9 kcal/mol), EGFR_Norcepharadione B (−8.9 kcal/mol), EGFR_Aristolactam AII (−8.4 kcal/mol), STAT3_Aristolodione (−7.6 kcal/mol), HSP90AA1_Pellitorine (−7.5 kcal/mol), STAT3_Norcepharadione B (−7.2 kcal/mol), and TP53_Aristolodione (−7.1 kcal/mol). Figure 2 illustrates representative 3D and 2D interaction plots of five selected protein–ligand complexes showing strong predicted binding affinities.
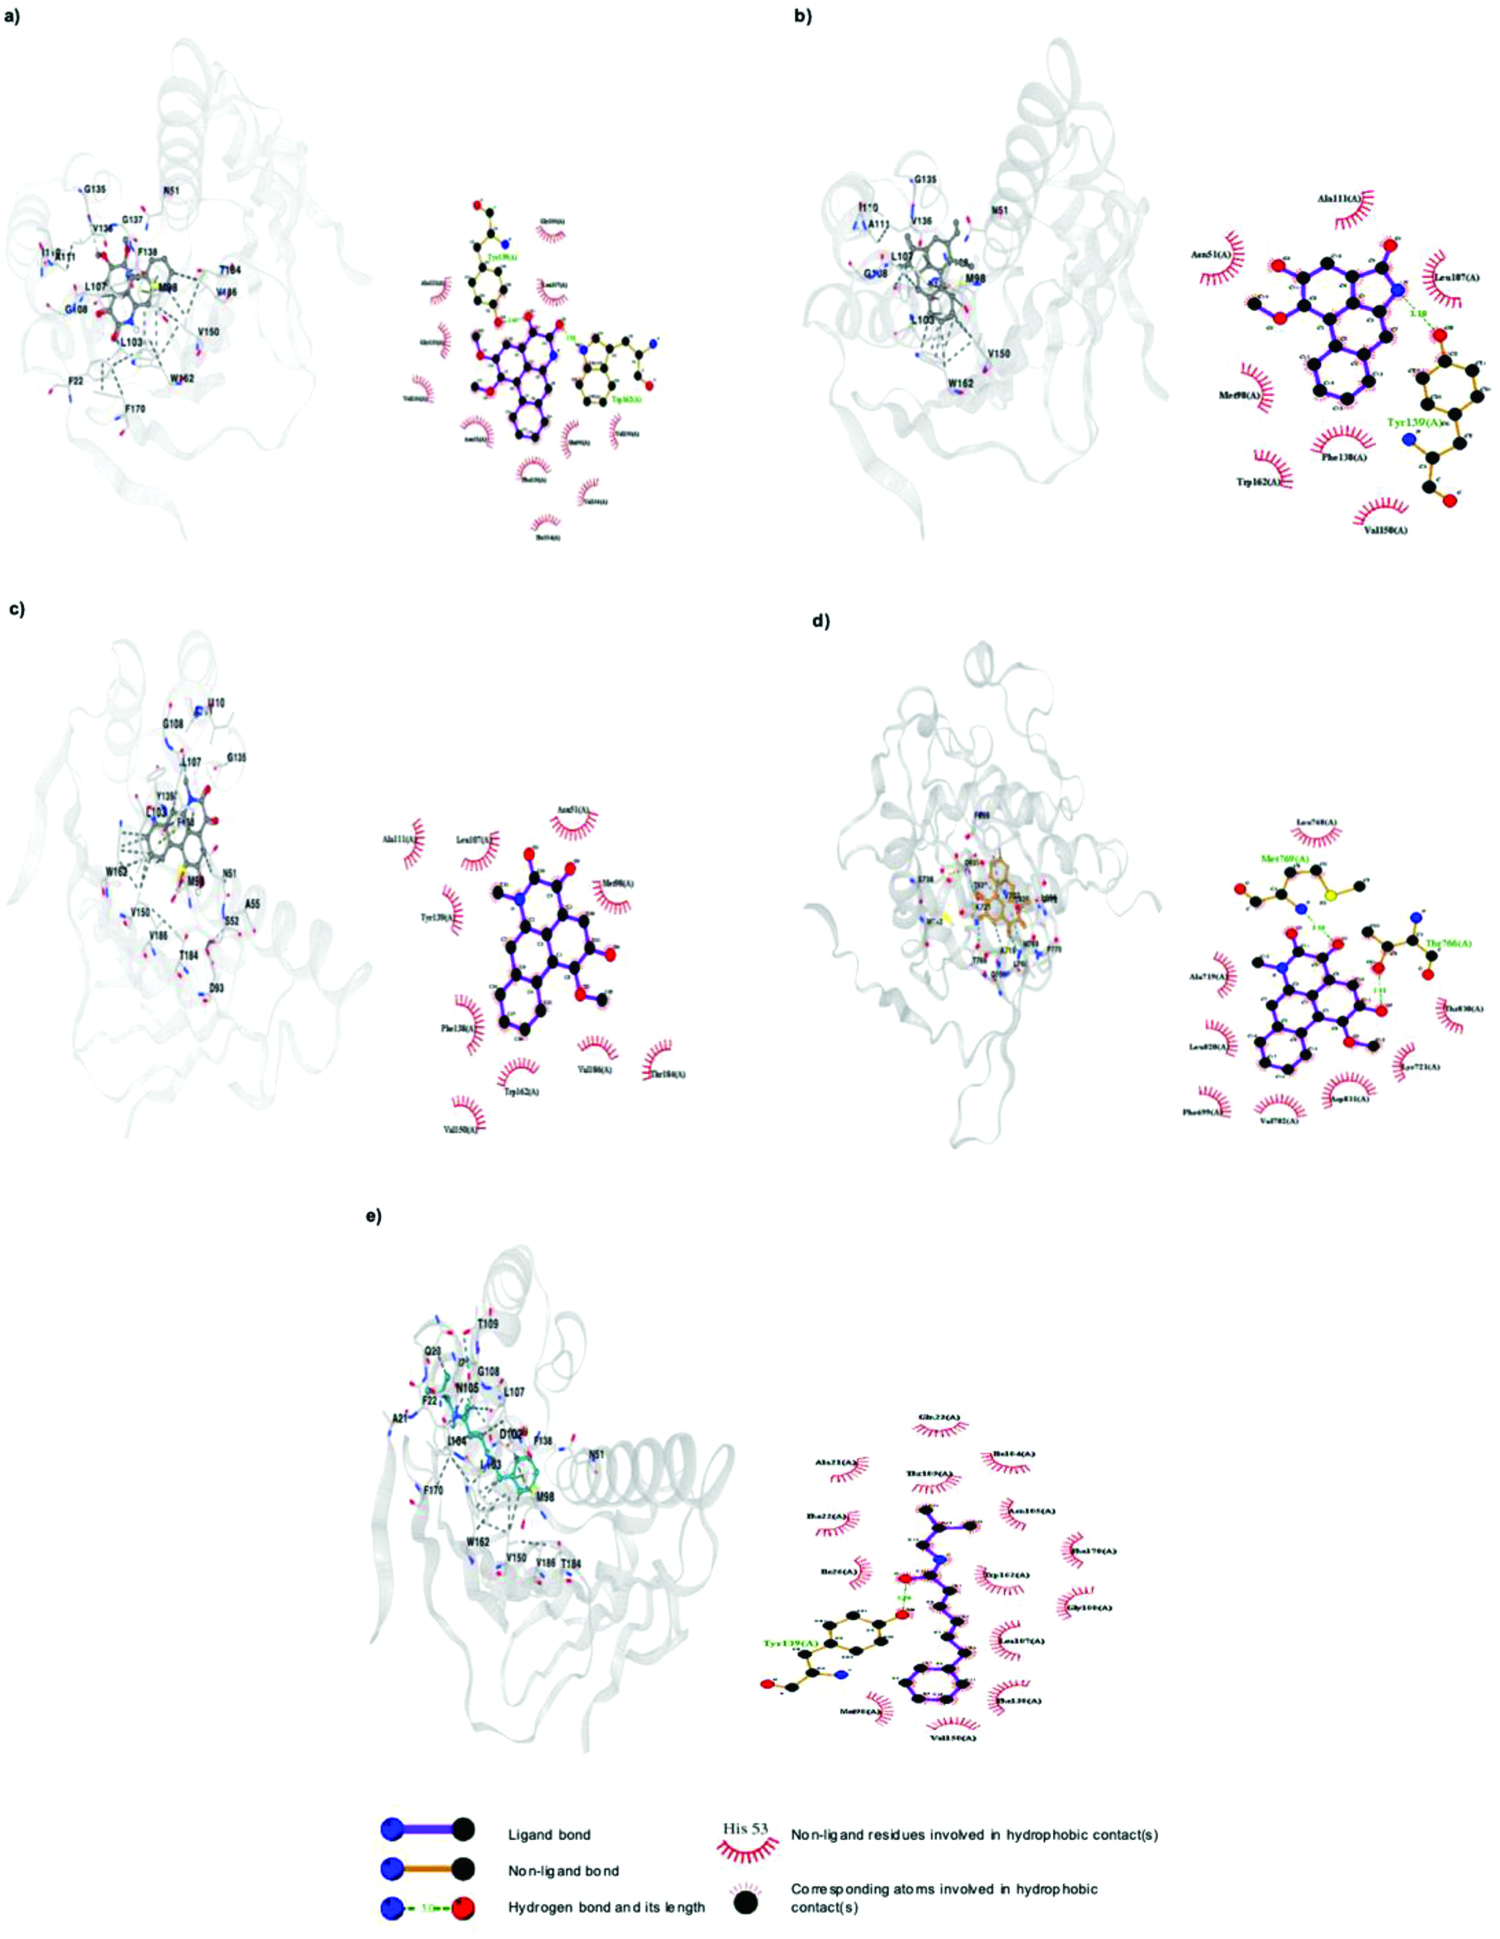
- Molecular docking results of key bioactive compounds of P. longum with breast cancer hub genes. (a) HSP90AA1_Norcepharadione B; (b) HSP90AA1_Aristolactam AII; (c) HSP90AA1_Aristolodione; (d) EGFR_Aristolodione; (e) HSP90AA1_N-isobutyl decadienamide.
Piperine Assessment for Validation of Extracts
To evaluate the validation of different extracts of P. longum, the extracts were analyzed for the presence of piperine, one of the most abundant alkaloids found in P. longum fruits, using HPTLC (Figure 3a–d). As shown in Figure 3b–d, the HPTLC chromatogram indicated the presence of piperine in hydro-alcoholic extracts prepared by the Soxhlet method (lanes 1 and 2), aqueous extracts obtained through cold maceration (lanes 5 and 6), and dried fruit extract (lanes 7 and 8), all compared to piperine standards with an RF value of approximately 0.16. The aforementioned extracts were then tested for microbial contamination at the Department of Microbiology, AIIA. Subsequently, a 1 mg/mL stock solution of this extract was prepared in PBS (pH 7.2–7.4) and stored at −20°C for use in in vitro experiments (Figure 3e). Notably, piperine was used solely as a phytochemical marker for extract characterization and was not selected based on its network pharmacology ranking. In contrast, Norcepharadione B and Aristolactam AII were prioritized independently through the computational network pharmacology and molecular docking analyses based on their predicted interactions with breast cancer-associated targets. Thus, HPTLC detection of piperine provides chemical evidence for the characteristic composition of the extract but should not be interpreted as experimental validation of the predicted activities of Norcepharadione B, Aristolactam AII, or other computationally prioritized compounds.
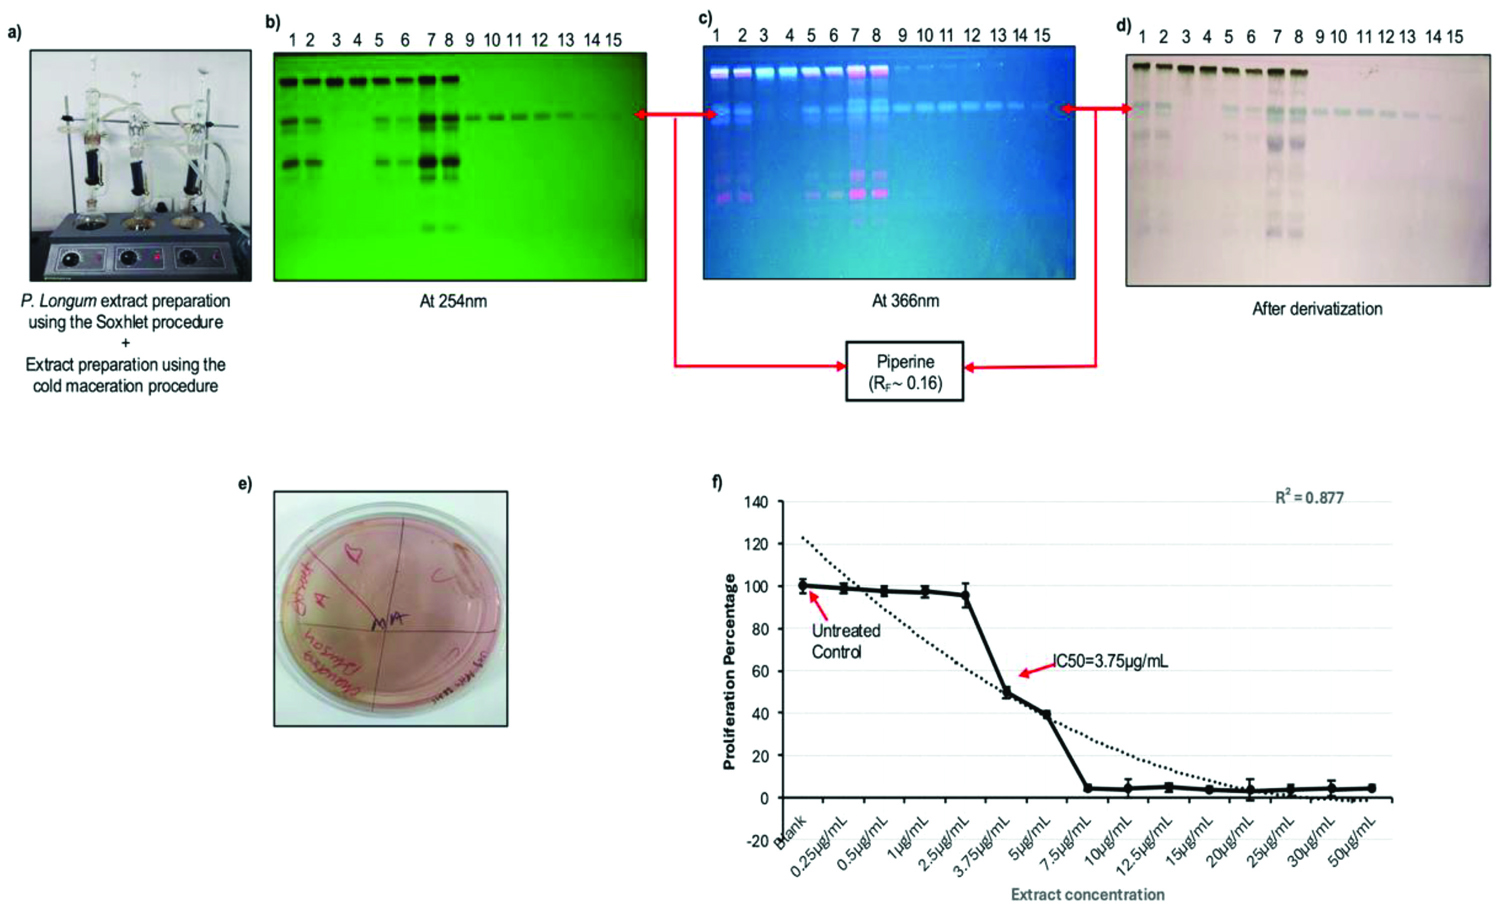
- (a) Extract preparation. (b–d) HPTLC profile of standard and isolated piperine from different extraction methods and extract of P. longum dried fruits at 254nm (b), 366nm (c) and after derivatization (d) [1–2: Isolated Piperine from hydro-alcoholic Soxhlet method; 3–4: aqueous Soxhlet method; 5–6: cold maceration method; 7–8: P. longum dried fruit extract; 9–15: Piperine standard]. (e) Anti-microbial assessment of different extracts (A-Hydro-alcoholic extract by the Soxhlet method; B-aqueous extract by the Soxhlet method, and C-aqueous extract by the cold maceration method) on a Macconkey agar plate. (f) Line graph showing the effect of aqueous extract of P. longum on the growth of MCF-7 cell line using MTT assay.
Since we needed to treat the MCF-7 breast cancer cells with these extracts for subsequent experiments, we preferred to use the aqueous extract of P. longum prepared by cold maceration to minimize cell death caused by alcohol in the hydro-alcoholic extract.
Effect of P. longum Extract on MCF-7 MTT Signal
The effect of P. longum extract on MCF-7 MTT signal was analyzed after 24 hours of treatment using an MTT assay. The assay was conducted in both the extract-treated and untreated (control) groups. IC50 was reached at an extract concentration of 3.75 μg/mL (Figure 3f) after 24 hours post-treatment. Interestingly, increasing P. longum extract concentration was associated with a decrease in MCF-7 cell MTT signal; data are presented as mean ± standard deviation (SD) (Supplementary Table 8).
DISCUSSION
Network pharmacology provides a systematic framework for investigating the multi-target and multi-pathway effects of phytochemicals in complex diseases such as breast cancer. By integrating phytochemical information, disease-associated genes, PPI networks, pathway enrichment, and molecular docking, this approach can identify potential molecular targets and generate mechanistic hypotheses for further experimental validation.[37] In the present study, network pharmacology analysis identified several Piper longum-associated phytochemicals along with potential breast cancer-related targets, including TP53, CTNNB1, STAT3, SMAD3, EGFR, and HSP90AA1, which are involved in key biological processes regulating cell proliferation, survival, apoptosis, invasion, metastasis, and therapeutic resistance, thereby providing a computationally predicted basis for the potential anticancer activity of P. longum. These findings predicted P. longum-derived compounds and breast-cancer-associated targets that warrant direct experimental testing.
TP53 is among the most frequently altered genes in breast cancer and regulates cell-cycle progression, DNA damage responses, senescence, and apoptosis.[38] Similarly, CTNNB1, which encodes β-catenin, is a central component of Wnt signaling and has been associated with breast cancer progression and clinical outcome.[39] Constitutive activation of STAT3 contributes to breast cancer cell proliferation, survival, metastasis, and resistance to therapy, whereas SMAD3 overexpression has been associated with breast tumor growth and metastatic potential.[40–41] EGFR signaling is also involved in several downstream pathways, including JAK/STAT, PI3K/AKT, and RAS/RAF/MEK/ERK, which regulate cancer cell proliferation and survival and contribute to therapeutic resistance.[42] Furthermore, HSP90AA1 has been implicated in breast cancer biology and has potential diagnostic and prognostic relevance.[43] Thus, the network pharmacology analysis predicts that P. longum phytochemicals may modulate multiple oncogenic pathways rather than a single molecular target. These computational predictions require further experimental validation.
Functional enrichment analysis further supported this multi-target mechanism. The shared targets between P. longum phytochemicals and breast cancer were enriched in biological processes associated with growth-factor responses, responses to endogenous and chemical stimuli, and signal transduction. These findings are consistent with the established role of the tumor microenvironment in regulating cancer-cell metabolism, nutrient availability, and signaling. KEGG pathway analysis further identified enrichment of the PI3K–AKT, FOXO, microRNA, cancer-related, proteoglycan, and viral carcinogenesis pathways. Among these, the PI3K–AKT pathway is particularly relevant because it regulates proliferation, growth, survival, apoptosis, and migration and is frequently dysregulated in breast cancer. FOXO transcription factors are also closely linked to cellular stress responses, apoptosis, cancer-cell survival, and resistance to targeted therapies. In addition, microRNAs and proteoglycans may influence post-transcriptional gene regulation and extracellular-matrix-mediated processes involved in tumor invasion and metastasis.[44]
Molecular docking provided computational predictions regarding the potential interactions between selected P. longum phytochemicals and breast cancer-associated hub proteins. Among the evaluated interactions, Norcepharadione B showed the strongest predicted docking score toward HSP90AA1 (−10.9 kcal/mol), followed by Aristolactam AII (−10.7 kcal/mol) and Aristolodione (−10.3 kcal/mol). HSP90AA1 is a molecular chaperone that contributes to the stabilization and functional regulation of multiple oncogenic proteins.[45] Therefore, the favorable docking scores observed for these phytochemicals indicate that HSP90AA1 may represent a potential molecular target for future investigation. However, the present docking analysis does not demonstrate direct binding or modulation of HSP90AA1-mediated signaling, and these predicted interactions require biochemical and functional validation.
Importantly, the present study also reported experimental assessment of the effect of the aqueous P. longum extract on MCF-7 breast cancer cells. The growth-inhibitory effect was observed in the MTT assay. Previous studies have reported that piperlongumine, an individual constituent of P. longum, inhibits proliferation and induces cell-cycle arrest through ROS accumulation and suppression of IKKβ signaling. Although the precise mechanisms may differ, these published findings support the possibility that P. longum-derived phytochemicals influence cellular metabolism.[46] Additionally, piperine has also been reported to inhibit breast cancer cell growth and induce apoptosis, accompanied by caspase-3 activation.[4] Further, Prajapati et al.[5] explained that the combination of piperine and piperlongumine induces apoptosis in breast cancer cells by inhibiting STAT3 activation.[5] These findings are particularly relevant to the present network pharmacology results, in which STAT3 was predicted to be one of the major breast cancer-associated targets. Nevertheless, because the present study did not directly measure STAT3 activity or downstream apoptotic proteins, this mechanistic relationship should be considered a hypothesis requiring further validation. These observations are broadly consistent with the current findings and suggest that members of the Piperaceae family may exert anticancer activity through coordinated regulation of cell-cycle progression and apoptotic pathways. However, the differences in the specific cell-cycle phase affected by different Piper species and preparations highlight the importance of extract composition, extraction method, dose, and cellular context.
Strengths and Limitations
Taken together, the findings support a model in which the aqueous P. longum extract might exert anticancer activity through a multi-level mechanism. Network pharmacology predicted several cancer-associated molecular targets and pathways, while molecular docking prioritized putative compound-target interactions for further investigation. An in vitro study in MCF-7 cells demonstrated that the aqueous extract of P. longum significantly inhibits the MTT signal of the breast cancer cell line. These results suggest that the anticancer effects of P. longum may arise from the coordinated modulation of multiple signaling pathways involved in proliferation and survival.
The present study has several limitations that should be acknowledged. First, although the aqueous P. longum extract was characterized using HPTLC with piperine as a marker compound, comprehensive chemical standardization and quantitative estimation of the prioritized phytochemicals identified through network pharmacology, including Norcepharadione B and Aristolactam AII, were not performed. Therefore, the biological activity observed in the present study cannot be directly attributed to any individual constituent of the extract. Second, the in vitro experiments used only a single breast cancer cell line (MCF-7). Validation in additional breast cancer subtypes, including triple-negative and HER2-positive cell lines, would improve the generalizability of the findings. Third, the present study did not include a non-tumorigenic human breast epithelial cell line as a normal-cell comparator. Consequently, the selectivity of the extract toward cancer cells relative to normal cells could not be assessed. Finally, although the MTT assay demonstrated a significant reduction in cellular metabolic activity following treatment with the aqueous P. longum extract, plant-derived compounds may occasionally interfere with tetrazolium-based colorimetric assays through direct chemical reduction or intrinsic color. To minimize this possibility, the MTT findings should be complemented with independent cell-cycle and Annexin V/PI apoptosis assays, which consistently demonstrated cell-cycle arrest and increased apoptotic cell death. Nevertheless, additional orthogonal viability assays (such as ATP-based luminescence or live-cell imaging assays) would further strengthen these observations. An additional limitation of the present network pharmacology approach is that hub-gene prioritization was based on network topology analysis. Centrality measures, including degree, betweenness, and closeness centrality, preferentially identify highly connected and extensively studied genes within biological interaction networks. Consequently, these metrics do not necessarily identify the most disease-specific, biologically causal, or therapeutically druggable targets. Therefore, the hub genes identified in this study should be regarded as computationally prioritized candidates for further investigation rather than experimentally validated therapeutic targets. Future studies integrating functional genomics, target validation, and pharmacological experiments are needed to establish their biological significance and clinical relevance.
In brief, the computational predictions should not be interpreted as experimentally confirmed molecular mechanisms. Direct validation of the predicted interactions and pathways through target-specific approaches, including quantitative PCR, Western blotting, assessment of protein phosphorylation, and functional target inhibition or rescue experiments, will be warranted and will be carried out in our lab in the near future.
CONCLUSION AND IMPLICATIONS FOR TRANSLATION
The present study integrated network pharmacology and molecular docking to identify potential phytochemicals, molecular targets, and biological pathways that may contribute to the anticancer activity of Piper longum against breast cancer. The computational analyses generated hypotheses about compound–target interactions. At the same time, the in vitro experiments demonstrated that the aqueous P. longum extract reduces the MTT signal in MCF-7 cells. However, these findings should not be interpreted as evidence that specific phytochemicals directly interact with the predicted molecular targets or as proof of therapeutic efficacy. Instead, the present work provides a rational starting point for future compound-specific studies involving chemical standardization, target validation, mechanistic investigations, and comprehensive preclinical evaluation. Such studies will be essential to determine the biological relevance and translational potential of the identified phytochemicals before clinical application can be considered.
Acknowledgments
Shivam Singh thanks the Indian Council of Medical Research (ICMR; 5/13/58/2020/NCD-III) for providing the Project Research Scientist-II fellowship. We are also grateful to Mr Santosh Kumar, a PhD student in the Department of Biochemistry at AIIMS, New Delhi, India, for his valuable assistance with molecular docking and visualization analysis.
COMPLIANCE WITH ETHICAL STANDARDS
Conflicts of Interest: The authors declare no competing interests. Financial Disclosure: Nothing to declare. Funding/Supported: The study was financially supported by the ICMR (5/13/58/2020/NCD-III). Ethics Approval: Not Applicable. Use of Artificial Intelligence (AI)-Assisted Technology for Manuscript Preparation: The author(s) confirm that there was no use of AI-Assisted Technology for assisting in the writing or editing of the manuscript and no images were manipulated using AI. Disclaimer: None.
Key Messages
1) Piper longum shows promising anticancer potential because its bioactive phytochemicals may act on multiple breast cancer-related targets and signaling pathways. 2) Experimental findings support this potential, with the aqueous extract demonstrating growth-inhibitory and pro-apoptotic effects in MCF-7 breast cancer cells. 3) Findings provide a foundation for plant-derived, multi-target therapeutic development, but further compound-specific validation, mechanistic studies, and comprehensive preclinical evaluation are required before clinical potential can be established.
REFERENCES
- . Global cancer statistics 2022: GLOBOCAN estimates of incidence and mortality worldwide for 36 cancers in 185 countries. CA Cancer J Clin. 2024;74(3):229–63.
- [Google Scholar]
- Anti-inflammatory and antitumour activity of various extracts and compounds from the fruits of Piper longum L. J Pharm Pharmacol. 2019 Jul;71(7):1162–71.
- [Google Scholar]
- . Piperine suppresses tumor growth and metastasis in vitro and in vivo in a 4T1 murine breast cancer model. Acta Pharmacol Sin. 2012 Apr;33(4):523–30.
- [Google Scholar]
- Piper chaba, an Indian spice plant extract, inhibits cell cycle G1/S phase transition and induces intrinsic apoptotic pathway in luminal breast cancer cells. Cell Biochem Funct. 2023 Dec;41(8):1230–41.
- [Google Scholar]
- Overview for various aspects of the health benefits of Piper longum linn. fruit. J Acupunct Meridian Stud. 2011;4(2):134–40.
- [Google Scholar]
- SwissADME: a free web tool to evaluate pharmacokinetics, drug-likeness and medicinal chemistry friendliness of small molecules. Sci Rep. 2017;7:42717.
- [Google Scholar]
- . Network pharmacology analysis and experimental validation to explore the mechanism of Bushao Tiaozhi capsule (BSTZC) on hyperlipidemia. Sci Rep. 2022;12:6992.
- [Google Scholar]
- . SuperPred: update on drug classification and target prediction. Nucleic Acids Res. 2014;42:W26–31.
- [Google Scholar]
- SwissTargetPrediction: a web server for target prediction of bioactive small molecules. Nucleic Acids Res. 2014;42:W32–38.
- [Google Scholar]
- DIGEP-Pred: web service for in silico prediction of drug-induced gene expression profiles based on structural formula. Bioinforma Oxf Engl. 2013;29:2062–3.
- [Google Scholar]
- . Computational investigation of benzalacetophenone derivatives against SARS-CoV-2 as potential multi-target bioactive compounds Comput Biol Med. 2022;146:105668.
- [Google Scholar]
- OMIM.org: online mendelian inheritance in man (OMIM®), an online catalog of human genes and genetic disorders. Nucleic Acids Res. 2015;43:D789–798.
- [Google Scholar]
- . The GeneCards suite: from gene data mining to disease genome sequence analyses. Curr Protoc Bioinforma. 2016;54:1.30.1-1.30.33.
- [Google Scholar]
- In silico prediction of novel therapeutic targets using gene-disease association data. J Transl Med. 2017;15:182.
- [Google Scholar]
- . The STRING database in 2017: quality-controlled protein-protein association networks, made broadly accessible. Nucleic Acids Res. 2017;45:D362–8.
- [Google Scholar]
- Cytoscape: software for visualization and analysis of biological networks. Methods Mol Biol. 2011;696:291–303.
- [Google Scholar]
- Unraveling the multi-targeted curative potential of bioactive molecules against cervical cancer through integrated omics and systems pharmacology approach. Sci Rep. 2022;12:14245.
- [Google Scholar]
- ShinyGO: a graphical gene-set enrichment tool for animals and plants. Bioinformaticx. 2020;36(8):2628–9.
- [Google Scholar]
- . Transcriptomics, cheminformatics, and systems pharmacology strategies unveil the potential bioactives to combat COVID-19. Molecules. 2022;27(18):5955.
- [Google Scholar]
- GEPIA2: an enhanced web server for large-scale expression profiling and interactive analysis Nucleic Acids Res. 2019;47(W1):W556–60.
- [Google Scholar]
- . Integrated omics profiling and network pharmacology uncovers the prognostic genes and multi-targeted therapeutic bioactives to combat lung cancer. Eur J Pharmacol. 2023;940:175479.
- [Google Scholar]
- Independent prognostic implications of RRM2 in lung adenocarcinoma. J Cancer. 2020;11:7009–22.
- [Google Scholar]
- . Updated resources for exploring experimentally-determined PDB structures and computed structure models at the RCSB protein data bank. Nucleic Acids Res. 2025;53(D1):D564–74.
- [Google Scholar]
- CB-Dock2: improved protein-ligand blind docking by integrating cavity detection, docking and homologous template fitting. Nucleic Acids Res. 2022;50: W159–64.
- [Google Scholar]
- LIGPLOT: a program to generate schematic diagrams of protein-ligand interactions. Protein Eng. 1995;8:127–34.
- [Google Scholar]
- Reversal of the DNA-binding-induced loop L1 conformational switch in an engineered human p53 protein. J Mol Biol. 2014 Feb 20;426(4):936–44.
- [Google Scholar]
- Human beta-catenin crystal structure: 8y0g [Internet]. Worldwide Protein Data Bank; 2024 [cited 2025 Jul 24]. Available from: https://www.wwpdb.org/pdb?id=pdb_00008y0g. doi: 10.2210/pdb8y0g/pdb.
- [Google Scholar]
- . A potent and selective small-molecule degrader of stat3 achieves complete tumor regression in vivo. Cancer Cell. 2019 Nov 11;36(5):498–511.e17.
- [Google Scholar]
- Smad3 allostery links TGF-beta receptor kinase activation to transcriptional control. Genes Dev. 2002 Aug 1;16(15):1950–63.
- [Google Scholar]
- Structure of the epidermal growth factor receptor kinase domain alone and in complex with a 4-anilinoquinazoline inhibitor. J Biol Chem. 2002 Nov 29;277(48):46265–72.
- [Google Scholar]
- . Discovery of NMS-E973 as novel, selective and potent inhibitor of heat shock protein 90 (Hsp90). Bioorg Med Chem. 2013 Nov 15;21(22):7047–63.
- [Google Scholar]
- Network pharmacology identifies therapeutic targets and the mechanisms of glutathione action in ferroptosis occurring in oral cancer. Front Pharmacol. 2022;13:851540.
- [Google Scholar]
- . Comprehensive molecular portraits of human breast tumours. Nature. 2012 Oct 4;490(7418):61–70.
- [Google Scholar]
- PTCH1 and CTNNB1 emerge as pivotal predictors of resistance to neoadjuvant chemotherapy in ER+/HER2- breast cancer. Front Oncol. 2023 Aug 28;13.
- [Google Scholar]
- Role of STAT3 signaling pathway in breast cancer. Cell Commun Signal CCS. 2020 Feb 28;18(1):33.
- [Google Scholar]
- SMAD3, cell proliferation and lymph nodes metastasis in breast cancer hormone-dependent. Tunis Med. 2023 Feb 11;101(2):273–9.
- [Google Scholar]
- . Therapeutic resistance in breast cancer cells can result from deregulated EGFR signaling. Adv Biol Regul. 2020 Dec;78:100758.
- [Google Scholar]
- . Exploring breast cancer exosomes for novel biomarkers of potential diagnostic and prognostic importance. 3 Biotech. 2023 Jan;13(1):7.
- [Google Scholar]
- Roles of proteoglycans and glycosaminoglycans in cancer development and progression. Int J Mol Sci. 2020 Aug 20;21(17):5983.
- [Google Scholar]
- . Amplification and high-level expression of heat shock protein 90 marks aggressive phenotypes of human epidermal growth factor receptor 2 negative breast cancer. Breast Cancer Res. 2012 Apr 17;14(2):R62.
- [Google Scholar]
- . Piperlongumine induces cell cycle arrest via reactive oxygen species accumulation and IKKβ suppression in human breast cancer cells. Antioxidants (Basel). 2019 Nov 14;8(11):553.
- [Google Scholar]
Supplementary Figures
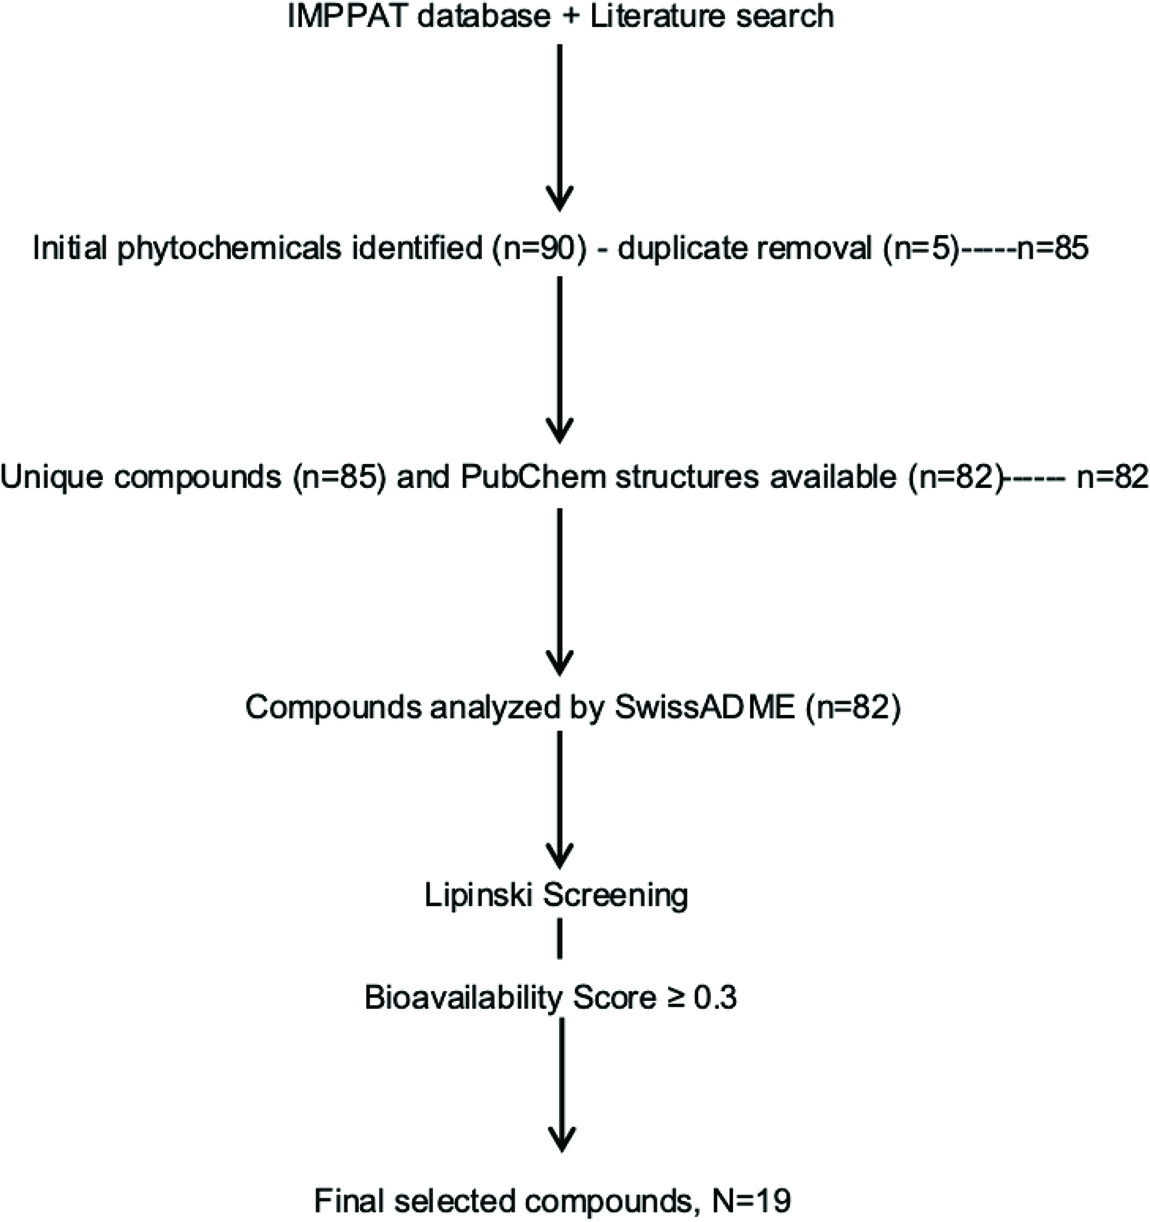
- Flow diagram demonstrating the screening pipeline for compound selection.
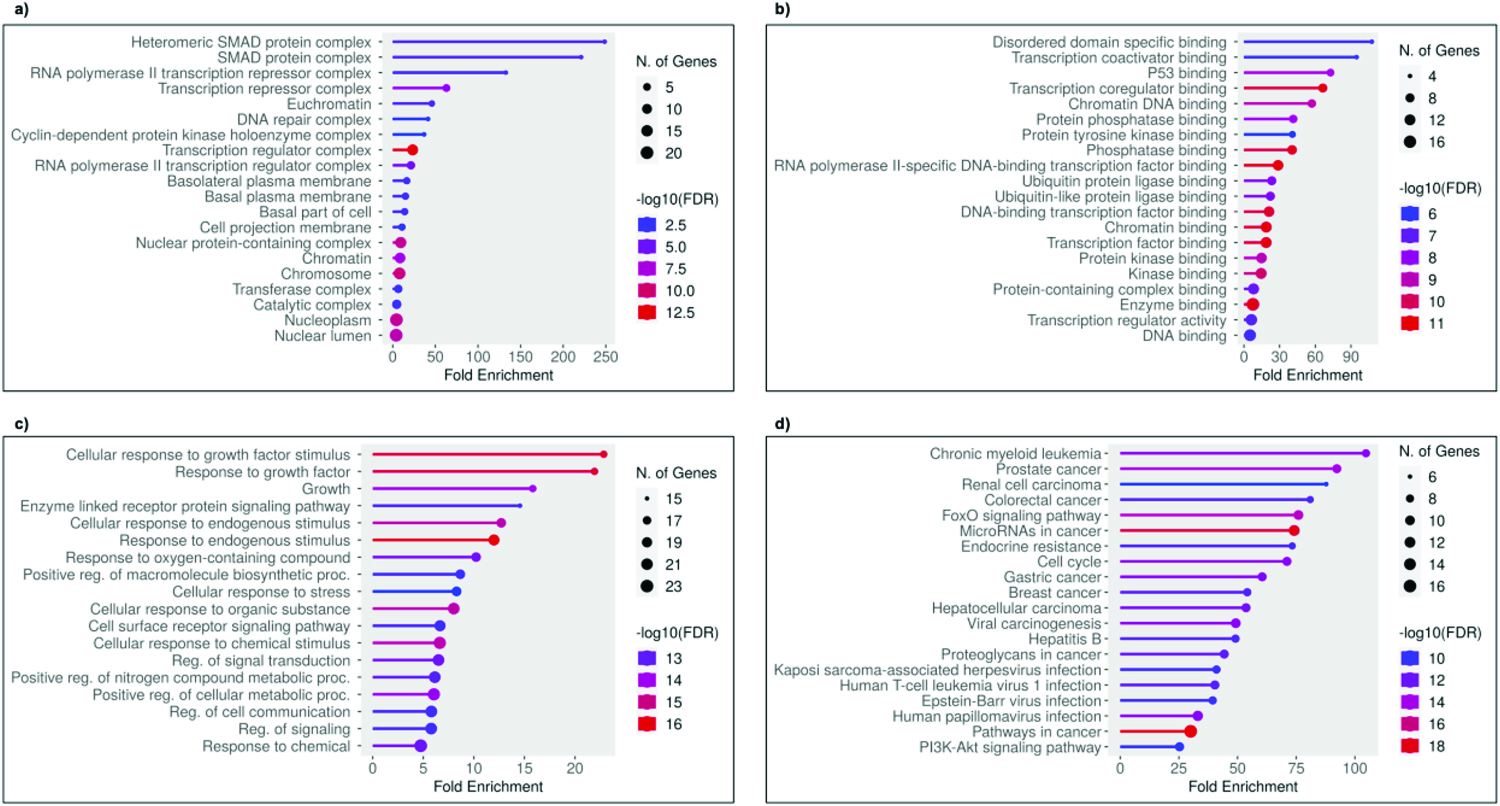
- Top 23 GO terms and KEGG pathways associated with P. longum and breast cancer. (a) Cellular Components, (b) Molecular Functions, (c) Biological Processes, and (d) KEGG pathway.
![Box plots encode the six breast cancer-associated gene expression levels [(a) TP53, (b) CTNNB1, (c) STAT3, (d) SMAD3, (e) EGFR, and (f) HSP90AA1] in BRCA compared with normal cells. Tumor tissues are marked in red color, and noncancerous or normal tissues are marked in grey color.](https://ijtmrph.org/index.php/ijtmrph/article/download/266/version/266/337/1979/ijtmrph-10-e010-g006.jpg)
- Box plots encode the six breast cancer-associated gene expression levels [(a) TP53, (b) CTNNB1, (c) STAT3, (d) SMAD3, (e) EGFR, and (f) HSP90AA1] in BRCA compared with normal cells. Tumor tissues are marked in red color, and noncancerous or normal tissues are marked in grey color.
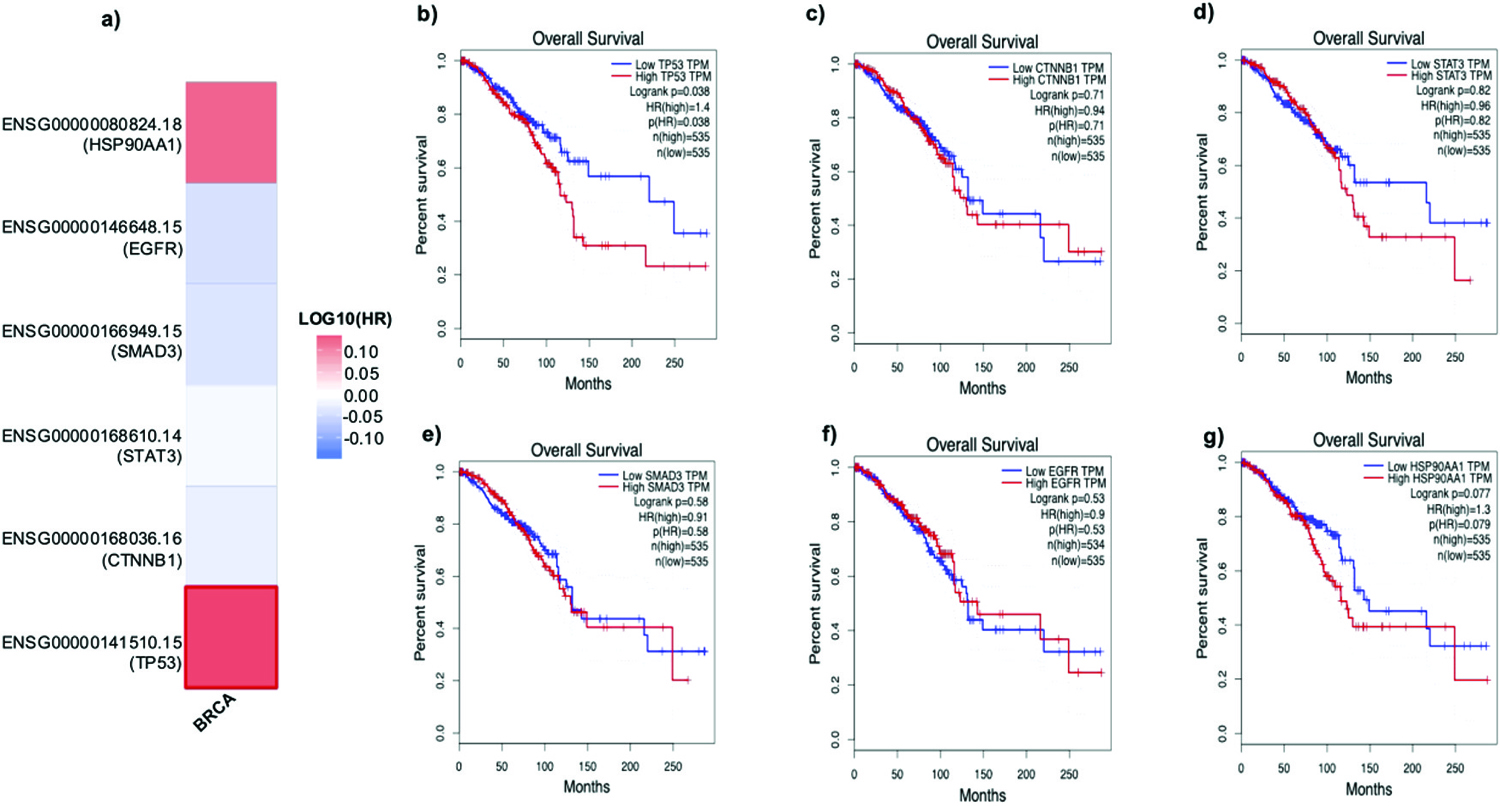
- Survival analysis demonstrating (a) the survival heat map representing the prognostic impacts of unique gene expression levels based on the TCGA_BRCA dataset. The heat map represents the hazard ratios on a log10 scale for the breast cancer-associated genes. Red color represents higher risks, and blue color indicates lower risks. The darkened rectangular frames indicate significant favorable and unfavorable results in prognostic analyses, and (b–g) breast cancer-associated unique genes and their prognostic value, as represented by overall survival analyses (Kaplan-Meier plots and log-rank tests) based on TCGA_BRCA using GEPIA2. The dashed lines denote upper and lower confidence intervals. (b) TP53, (c) CTNNB1, (d) STAT3, (e) SMAD3, (f) EGFR, and (g) HSP90AA1.
Supplementary Tables
| S. no. | Extraction method | Starting powder | Dried extract | Yield (%) |
|---|---|---|---|---|
| 1 | Cold aqueous | 400 g | 48.2 g | 12.05 |
| 2 | Soxhlet aqueous | 400 g | 39.8 g | 9.95 |
| 3 | Soxhlet hydroalcoholic | 400 g | 66.4 g | 16.6 |
| S. no. | Compounds in fruit | Canonical/isomeric SMILES | PubChem compounds (CIDs) |
|---|---|---|---|
| 1 | (-)-alpha-Cadinol | CC1=C[C@H]2[C@@H](CC[C@@]([C@@H]2CC1)(C)O)C(C)C | 10398656 |
| 2 | (+)-alpha-Gurjunene | C[C@H]1CC[C@H]2[C@H](C2(C)C)C3=C(CC[C@@H]13)C | 15560275 |
| 3 | (+)-beta-Phellandrene | CC(C)[C@@H]1CCC(=C)C=C1 | 442484 |
| 4 | (1R)-2-methyl-5-propan-2-ylbicyclo[3.1.0]hex-2-ene | CC1=CC[C@]2([C@@H]1C2)C(C)C | 637518 |
| 5 | (E)-beta-ocimene | CC(=CC/C=C(\\C)/C=C)C | 5281553 |
| 6 | (Z)-beta-Ocimene | CC(=CC[C@@H]1[C@@](O1)(C)C=C)C | 5320250 |
| 7 | (Z)-gamma-bisabolene | CC1=CC/C(=C(/C)\\CCC=C(C)C)/CC1 | 3033866 |
| 8 | 1-methylhexyl acetate | CCCCCC(C)OC(=O)C | 80018 |
| 9 | 1-pentadecene | CCCCCCCCCCCCCC=C | 25913 |
| 10 | 2-nonanone | CCCCCCCC(=O)C | 13187 |
| 11 | 2-phenylethanol | C1=CC=C(C=C1)CCO | 6054 |
| 12 | 2-tridecanone | CCCCCCCCCCCC(=O)C | 11622 |
| 13 | 2-undecanone | CCCCCCCCCC(=O)C | 8163 |
| 14 | 4’-methoxyacetophenone | CC(=O)C1=CC=C(C=C1)OC | 7476 |
| 15 | 5-[3-(1,3-benzodioxol-5-yl)-1,3,3a,4,6,6a-hexahydrofuro[3,4-c]furan-6-yl]-1,3-benzodioxole | C1C2C(COC2C3=CC4=C(C=C3)OCO4)C(O1)C5=CC6=C(C=C5)OCO6 | 5204 |
| 16 | 9-Eicosyne | CCCCCCCCCCC#CCCCCCCCC [1, 2] | 557019 |
| 17 | alpha-Eudesmol | CC1=CCC[C@]2([C@H]1C[C@@H](CC2)C(C)(C)O)C | 92762 |
| 18 | alpha-Muurolene | CC1=C[C@@H]2[C@H](CC1)C(=CC[C@H]2C(C)C)C | 12306047 |
| 19 | alpha-Phellandrene | CC1=CCC(C=C1)C(C)C | 7460 |
| 20 | alpha-Pinene | CC1=CCC2CC1C2(C)C | 6654 |
| 21 | alpha-Terpineol | CC1=CCC(CC1)C(C)(C)O | 17100 |
| 22 | alpha-Terpinyl acetate | CC1=CCC(CC1)C(C)(C)OC(=O)C | 111037 |
| 23 | Aristolactam AII | COC1=C(C=C2C3=C1C4=CC=CC=C4C=C3NC2=O)O | 148657 |
| 24 | Aristolactam BII | COC1=C(C2=C3C(=C1)C(=O)NC3=CC4=CC=CC=C42)OC | 162739 |
| 25 | Aristolodione | CN1C2=CC3=CC=CC=C3C4=C2C(=CC(=C4OC)O)C(=O)C1=O | 184116 |
| 26 | Aristololactam | COC1=CC=CC2=C3C4=C(C=C21)NC(=O)C4=CC5=C3OCO5 | 96710 |
| 27 | beta-Caryophyllene | C/C/1=C\\CCC(=C)[C@H]2CC([C@@H]2CC1)(C)C | 5281515 |
| 28 | beta-Cubebene | CC(C)[C@@H]1CC[C@H]([C@H]2[C@]13[C@@H]2C(=C)CC3)C(C)C [1] | 93081 |
| 29 | beta-Elemene | CC(=C)[C@@H]1CC[C@@]([C@@H](C1)C(=C)C)(C)C=C | 6918391 |
| 30 | beta-Eudesmol | C[C@]12CCCC(=C)[C@@H]1C[C@@H](CC2)C(C)(C)O | 91457 |
| 31 | beta-Patchoulene | CC1CCC2=C1CC3CCC2(C3(C)C)C | 101731 |
| 32 | beta-Pinene | CC1(C2CCC(=C)C1C2)C | 14896 |
| 33 | Bornyl acetate | CC(=O)O[C@@H]1C[C@@H]2CC[C@]1(C2(C)C)C | 93009 |
| 34 | Cadinane | C[C@H]1CC[C@H]2[C@H](CC[C@H]([C@@H]2C1)C(C)C)C | 9548708 |
| 35 | Camphene | CC1(C2CCC(C2)C1=C)C | 6616 |
| 36 | Caryophyllene oxide | C[C@@]12CC[C@@H]3[C@H](CC3(C)C)C(=C)CC[C@H]1O2 | 1742210 |
| 37 | Copaene | CC1=CC[C@H]2[C@H]3[C@@H]1[C@@]2(CC[C@H]3C(C)C)C | 12303902 |
| 38 | Decanal | CCCCCCCCCC=O | 8175 |
| 39 | Dehydropipernonaline | C1CCN(CC1)C(=O)/C=C/C=C/CC/C=C/C2=CC3=C(C=C2)OCO3 | 6439947 |
| 40 | delta-Cadinol | CC1=C[C@H]2[C@@H](CC[C@@]([C@H]2CC1)(C)O)C(C)C | 3084311 |
| 41 | delta-Elemene | CC(C)C1=C[C@@H]([C@@](CC1)(C)C=C)C(=C)C | 12309449 |
| 42 | Dihydrocarveol | CC1CCC(CC1O)C(=C)C | 12072 |
| 43 | Dodecanal | CCCCCCCCCCCC=O | 8194 |
| 44 | Eicosane | CCCCCCCCCCCCCCCCCCCC | 8222 |
| 45 | Elemol | CC(=C)[C@@H]1C[C@@H](CC[C@@]1(C)C=C)C(C)(C)O | 92138 |
| 46 | Eucalyptol | CC1(C2CCC(O1)(CC2)C)C | 2758 |
| 47 | Fargesin | COC1=C(C=C(C=C1)[C@H]2[C@H]3CO[C@@H]([C@H]3CO2)C4=CC5=C(C=C4)OCO5)OC | 10926754 |
| 48 | gamma-Elemene | CC(=C1CC[C@]([C@H](C1)C(=C)C)(C)C=C)C | 12309452 |
| 49 | gamma-Muurolene | CC1=C[C@@H]2[C@H](CC1)C(=C)CC[C@H]2C(C)C | 12313020 |
| 50 | Guineensine | CC(C)CNC(=O)/C=C/C=C/CCCCCC/C=C/C1=CC2=C(C=C1)OCO2 | 6442405 |
| 51 | Heneicosane | CCCCCCCCCCCCCCCCCCCCC | 12403 |
| 52 | Heptadecane | CCCCCCCCCCCCCCCCC | 12398 |
| 53 | Hexadecane | CCCCCCCCCCCCCCCC | 11006 |
| 54 | Humulene | C/C/1=C\\CC(/C=C/C/C(=C/CC1)/C)(C)C | 5281520 |
| 55 | Isobutyramide | CC(C)C(=O)N | 68424 |
| 56 | Limonene | CC1=CCC(CC1)C(=C)C | 22311 |
| 57 | Linalool | CC(=CCCC(C)(C=C)O)C | 6549 |
| 58 | Myrcene | CC(=CCCC(=C)C=C)C | 31253 |
| 59 | Nerolidol | CC(=CCC/C(=C/CCC(C)(C=C)O)/C)C | 5284507 |
| 60 | Nonadecane | CCCCCCCCCCCCCCCCCCC | 12401 |
| 61 | Norcepharadione B | COC1=C(C2=C3C(=C1)C(=O)C(=O)NC3=CC4=CC=CC=C42)OC | 189168 |
| 62 | Octadecane | CCCCCCCCCCCCCCCCCC | 11635 |
| 63 | p-Cymene | CC1=CC=C(C=C1)C(C)C | 7463 |
| 64 | Pellitorine | CCCCC/C=C/C=C/C(=O)NCC(C)C | 5318516 |
| 65 | Pentadecane | CCCCCCCCCCCCCCC | 12391 |
| 66 | Piperidine | C1CCNCC1 | 8082 |
| 67 | Piperine | C1CCN(CC1)C(=O)/C=C/C=C/C2=CC3=C(C=C2)OCO3 | 638024 |
| 68 | Piperlongumine | COC1=CC(=CC(=C1OC)OC)/C=C/C(=O)N2CCC=CC2=O | 637858 |
| 69 | Piperlonguminine | CC(C)CNC(=O)/C=C/C=C/C1=CC2=C(C=C1)OCO2 | 5320621 |
| 70 | Pipernonaline | C1CCN(CC1)C(=O)/C=C/CCCC/C=C/C2=CC3=C(C=C2)OCO3 | 9974595 |
| 71 | Piperoctadecalidine | CCCC=CCCCCCCCCC=CC=CC(=O)N1CCCCC1 [1, 2] | 177604078 |
| 72 | Piperrolein B | C1CCN(CC1)C(=O)CCCCCC/C=C/C2=CC3=C(C=C2)OCO3 | 21580213 |
| 73 | Piperundecalidine | C1CCN(CC1)C(=O)/C=C/C=C/CCCC/C=C/C2=CC3=C(C=C2)OCO3 | 44453654 |
| 74 | Pluviatilol | COC1=C(C=CC(=C1)[C@@H]2[C@@H]3CO[C@H]([C@@H]3CO2)C4=CC5=C(C=C4)OCO5)O | 70695727 |
| 75 | Terpinolene | CC1=CCC(=C(C)C)CC1 | 11463 |
| 76 | Tridecane | CCCCCCCCCCCCC | 12388 |
| 77 | Zingiberene | CC1=CC[C@@H](C=C1)[C@@H](C)CCC=C(C)C | 92776 |
| 78 | Longamide B | C1C(N2C(=CC(=C2Br)Br)C(=O)N1)O | 11602770 |
| 79 | N-isobutyl decadienamide | CCCCCC=CC=CC(=O)NCC(C)C | 3009280 |
| 80 | Sesamin | C1[C@H]2[C@H](CO[C@@H]2C3=CC4=C(C=C3)OCO4)[C@H](O1)C5=CC6=C(C=C5)OCO6 | 72307 |
| 81 | Tetrahydropiperine | O=C(CCCCC1=CC(OCO2)=C2C=C1)N3CCCCC3 | 581676 |
| 82 | Tetrahydropiperic acid | OC(=O)CCCCC1=CC2=C(OCO2)C=C1 | 5321853 |
| Name of the compound | MW* | MR† | Rotatable bonds | XLOGP3‡ | H-bond acceptors | H-bond donors | Bioavailability score | GI absorption# | BBB penetration! |
|---|---|---|---|---|---|---|---|---|---|
| Norcepharadione B | 307.3 | 90.02 | 2 | 3.16 | 4 | 1 | 0.55 | High | Yes |
| Piperine | 285.3 | 85.47 | 4 | 3.46 | 3 | 0 | 0.55 | High | Yes |
| Aristolodione | 307.3 | 90.45 | 1 | 3.02 | 4 | 1 | 0.55 | High | Yes |
| Aristolactam BII | 279.3 | 83.75 | 2 | 3.28 | 3 | 1 | 0.55 | High | Yes |
| Dehydropipernonaline | 339.4 | 104.23 | 7 | 4.7 | 3 | 0 | 0.55 | High | Yes |
| Piperlongumine | 317.3 | 89.47 | 6 | 2.07 | 5 | 0 | 0.55 | High | Yes |
| Pluviatilol | 356.4 | 92.45 | 3 | 2.48 | 6 | 1 | 0.55 | High | Yes |
| Aristololactam | 293.3 | 83.32 | 1 | 3.12 | 4 | 1 | 0.55 | High | Yes |
| Fargesin | 370.4 | 96.92 | 4 | 2.81 | 6 | 0 | 0.55 | High | Yes |
| Pellitorine | 223.4 | 71.47 | 9 | 4.39 | 1 | 1 | 0.55 | High | Yes |
| Aristolactam AII | 265.3 | 79.28 | 1 | 2.95 | 3 | 2 | 0.55 | High | Yes |
| Longamide | 352 | 67.28 | 2 | 1.23 | 3 | 2 | 0.85 | High | Yes |
| Tetrahydropiperic acid | 222.2 | 58.47 | 5 | 2.54 | 4 | 1 | 0.85 | High | Yes |
| Piperettine | 311.4 | 94.61 | 5 | 4.11 | 3 | 0 | 0.55 | High | Yes |
| Asarinine | 354.4 | 90 | 2 | 2.68 | 6 | 0 | 0.55 | High | Yes |
| Demethoxypiplartine | 287.3 | 82.98 | 5 | 2.1 | 4 | 0 | 0.55 | High | Yes |
| N-isobutyl decadienamide | 223.4 | 71.47 | 9 | 3.69 | 1 | 1 | 0.55 | High | Yes |
| Tetrahydro piperine | 289.4 | 85.63 | 6 | 3.52 | 3 | 0 | 0.55 | High | Yes |
| Sesamin | 354.4 | 90 | 2 | 2.68 | 6 | 0 | 0.55 | High | Yes |
*Molecular weight;
†Number of rotatable bonds;
‡Partition coefficient;
#Gastrointestinal absorption; and Blood-Brain Barrier Penetration.
| S. no. | Gene name | Gene symbol | HGNC ID |
|---|---|---|---|
| 1 | ATP binding cassette subfamily A member 1 | ABCA1 | HGNC:29 |
| 2 | ATP binding cassette subfamily B member 1 | ABCB1 | HGNC:40 |
| 3 | ATP binding cassette subfamily C member 1 (ABCC1 blood group) | ABCC1 | HGNC:51 |
| 4 | ATP binding cassette subfamily C member 4 (PEL blood group) | ABCC4 | HGNC:55 |
| 5 | ATP binding cassette subfamily G member 2 (JR blood group) | ABCG2 | HGNC:74 |
| 6 | ABL proto-oncogene 1, non-receptor tyrosine kinase | ABL1 | HGNC:76 |
| 7 | Abraxas 1, BRCA1 A complex subunit | ABRAXAS1 | HGNC:25829 |
| 8 | Actin alpha 2, smooth muscle | ACTA2 | HGNC:130 |
| 9 | Actin beta | ACTB | HGNC:132 |
| 10 | Actin alpha cardiac muscle 1 | ACTC1 | HGNC:143 |
| 11 | ADAM metallopeptidase domain 17 | ADAM17 | HGNC:195 |
| 12 | Adrenoceptor beta 2 | ADRB2 | HGNC:286 |
| 13 | Argonaute RISC catalytic component 2 | AGO2 | HGNC:3263 |
| 14 | Aryl hydrocarbon receptor | AHR | HGNC:348 |
| 15 | AKT serine/threonine kinase 1 | AKT1 | HGNC:391 |
| 16 | AKT serine/threonine kinase 2 | AKT2 | HGNC:392 |
| 17 | AKT serine/threonine kinase 3 | AKT3 | HGNC:393 |
| 18 | Angiopoietin 1 | ANGPT1 | HGNC:484 |
| 19 | Angiopoietin 2 | ANGPT2 | HGNC:485 |
| 20 | APC regulator of Wnt signaling pathway | APC | HGNC:583 |
| 21 | Androgen receptor | AR | HGNC:644 |
| 22 | Amphiregulin | AREG | HGNC:651 |
| 23 | AT-rich interaction domain 1A | ARID1A | HGNC:11110 |
| 24 | ATM serine/threonine kinase | ATM | HGNC:795 |
| 25 | ATPase copper transporting beta | ATP7B | HGNC:870 |
| 26 | ATR checkpoint kinase | ATR | HGNC:882 |
| 27 | Aurora kinase A | AURKA | HGNC:11393 |
| 28 | AXL receptor tyrosine kinase | AXL | HGNC:905 |
| 29 | BCL2 antagonist/killer 1 | BAK1 | HGNC:949 |
| 30 | BRAF-activated non-protein coding RNA | BANCR | HGNC:43877 |
| 31 | BRCA1 associated deubiquitinase 1 | BAP1 | HGNC:950 |
| 32 | BRCA1 associated RING domain 1 | BARD1 | HGNC:952 |
| 33 | BCL2 associated X, apoptosis regulator | BAX | HGNC:959 |
| 34 | BCAR1 scaffold protein, Cas family member | BCAR1 | HGNC:971 |
| 35 | BCAR3 adaptor protein, NSP family member | BCAR3 | HGNC:973 |
| 36 | Brain enriched myelin associated protein 1 | BCAS1 | HGNC:974 |
| 37 | BCL2 apoptosis regulator | BCL2 | HGNC:990 |
| 38 | BCL2 like 1 | BCL2L1 | HGNC:992 |
| 39 | Brain cytoplasmic RNA 1 | BCYRN1 | HGNC:1022 |
| 40 | Baculoviral IAP repeat containing 3 | BIRC3 | HGNC:591 |
| 41 | Baculoviral IAP repeat containing 5 | BIRC5 | HGNC:593 |
| 42 | BLM RecQ like helicase | BLM | HGNC:1058 |
| 43 | Bridge-like lipid transfer protein family member 2 | BLTP2 | HGNC:28960 |
| 44 | BMI1 proto-oncogene, polycomb ring finger | BMI1 | HGNC:1066 |
| 45 | Bone morphogenetic protein 4 | BMP4 | HGNC:1071 |
| 46 | Bone morphogenetic protein 6 | BMP6 | HGNC:1073 |
| 47 | Bone morphogenetic protein receptor type 1A | BMPR1A | HGNC:1076 |
| 48 | B-Raf proto-oncogene, serine/threonine kinase | BRAF | HGNC:1097 |
| 49 | BRCA1 DNA repair associated | BRCA1 | HGNC:1100 |
| 50 | BRCA2 DNA repair associated | BRCA2 | HGNC:1101 |
| 51 | BRCA1 interacting DNA helicase 1 | BRIP1 | HGNC:20473 |
| 52 | BRMS1 transcriptional repressor and anoikis regulator | BRMS1 | HGNC:17262 |
| 53 | BUB1 mitotic checkpoint serine/threonine kinase | BUB1 | HGNC:1148 |
| 54 | BUB1 mitotic checkpoint serine/threonine kinase B | BUB1B | HGNC:1149 |
| 55 | Calcium voltage-gated channel auxiliary subunit alpha2delta 1 | CACNA2D1 | HGNC:1399 |
| 56 | Cancer susceptibility 15 | CASC15 | HGNC:28245 |
| 57 | Caspase 10 | CASP10 | HGNC:1500 |
| 58 | Caspase 3 | CASP3 | HGNC:1504 |
| 59 | Caspase 8 | CASP8 | HGNC:1509 |
| 60 | Caspase 9 | CASP9 | HGNC:1511 |
| 61 | Caveolin 1 | CAV1 | HGNC:1527 |
| 62 | Core-binding factor subunit beta | CBFB | HGNC:1539 |
| 63 | Cbl proto-oncogene | CBL | HGNC:1541 |
| 64 | C-C motif chemokine ligand 2 | CCL2 | HGNC:10618 |
| 65 | Cyclin A2 | CCNA2 | HGNC:1578 |
| 66 | Cyclin B1 | CCNB1 | HGNC:1579 |
| 67 | Cyclin D1 | CCND1 | HGNC:1582 |
| 68 | Cyclin D2 | CCND2 | HGNC:1583 |
| 69 | Cyclin D3 | CCND3 | HGNC:1585 |
| 70 | Cyclin E1 | CCNE1 | HGNC:1589 |
| 71 | CD274 molecule | CD274 | HGNC:17635 |
| 72 | CD3 gamma subunit of T-cell receptor complex | CD3G | HGNC:1675 |
| 73 | CD44 molecule (IN blood group) | CD44 | HGNC:1681 |
| 74 | CD82 molecule | CD82 | HGNC:6210 |
| 75 | Cell division cycle 25A | CDC25A | HGNC:1725 |
| 76 | Cell division cycle 73 | CDC73 | HGNC:16783 |
| 77 | Cadherin 1 | CDH1 | HGNC:1748 |
| 78 | Cadherin 3 | CDH3 | HGNC:1762 |
| 79 | Cyclin dependent kinase 1 | CDK1 | HGNC:1722 |
| 80 | Cyclin dependent kinase 2 | CDK2 | HGNC:1771 |
| 81 | Cyclin dependent kinase 4 | CDK4 | HGNC:1773 |
| 82 | Cyclin dependent kinase 6 | CDK6 | HGNC:1777 |
| 83 | Cyclin dependent kinase inhibitor 1A | CDKN1A | HGNC:1784 |
| 84 | Cyclin dependent kinase inhibitor 1B | CDKN1B | HGNC:1785 |
| 85 | Cyclin dependent kinase inhibitor 1C | CDKN1C | HGNC:1786 |
| 86 | Cyclin dependent kinase inhibitor 2A | CDKN2A | HGNC:1787 |
| 87 | Cyclin dependent kinase inhibitor 2B | CDKN2B | HGNC:1788 |
| 88 | Cyclin dependent kinase inhibitor 2C | CDKN2C | HGNC:1789 |
| 89 | Cyclin dependent kinase inhibitor 3 | CDKN3 | HGNC:1791 |
| 90 | CEA cell adhesion molecule 5 | CEACAM5 | HGNC:1817 |
| 91 | CCAAT enhancer binding protein alpha | CEBPA | HGNC:1833 |
| 92 | CF transmembrane conductance regulator | CFTR | HGNC:1884 |
| 93 | Checkpoint kinase 1 | CHEK1 | HGNC:1925 |
| 94 | Checkpoint kinase 2 | CHEK2 | HGNC:16627 |
| 95 | Cholinergic receptor nicotinic alpha 7 subunit | CHRNA7 | HGNC:1960 |
| 96 | CDC28 protein kinase regulatory subunit 1B | CKS1B | HGNC:19083 |
| 97 | Collagen type III alpha 1 chain | COL3A1 | HGNC:2201 |
| 98 | Catechol-O-methyltransferase | COMT | HGNC:2228 |
| 99 | cAMP responsive element binding protein 1 | CREB1 | HGNC:2345 |
| 100 | CREB binding lysine acetyltransferase | CREBBP | HGNC:2348 |
| 101 | Colorectal neoplasia differentially expressed | CRNDE | HGNC:37078 |
| 102 | Colony stimulating factor 1 | CSF1 | HGNC:2432 |
| 103 | Colony stimulating factor 1 receptor | CSF1R | HGNC:2433 |
| 104 | Colony stimulating factor 2 | CSF2 | HGNC:2434 |
| 105 | CCCTC-binding factor | CTCF | HGNC:13723 |
| 106 | Cytotoxic T-lymphocyte associated protein 4 | CTLA4 | HGNC:2505 |
| 107 | Catenin alpha 1 | CTNNA1 | HGNC:2509 |
| 108 | Catenin beta 1 | CTNNB1 | HGNC:2514 |
| 109 | Cathepsin D | CTSD | HGNC:2529 |
| 110 | C-X-C motif chemokine ligand 12 | CXCL12 | HGNC:10672 |
| 111 | C-X-C motif chemokine ligand 8 | CXCL8 | HGNC:6025 |
| 112 | C-X-C motif chemokine receptor 4 | CXCR4 | HGNC:2561 |
| 113 | Cytochrome c, somatic | CYCS | HGNC:19986 |
| 114 | CYLD lysine 63 deubiquitinase | CYLD | HGNC:2584 |
| 115 | Cytochrome P450 family 1 subfamily A member 1 | CYP1A1 | HGNC:2595 |
| 116 | Cytochrome P450 family 1 subfamily B member 1 | CYP1B1 | HGNC:2597 |
| 117 | Cytochrome P450 family 2 subfamily D member 6 (gene/pseudogene) | CYP2D6 | HGNC:2625 |
| 118 | Cytoskeleton regulator RNA | CYTOR | HGNC:28717 |
| 119 | DCC netrin 1 receptor | DCC | HGNC:2701 |
| 120 | Dynactin subunit 5 | DCTN5 | HGNC:24594 |
| 121 | Damage specific DNA binding protein 2 | DDB2 | HGNC:2718 |
| 122 | Discoidin domain receptor tyrosine kinase 1 | DDR1 | HGNC:2730 |
| 123 | DEAD-box helicase 5 | DDX5 | HGNC:2746 |
| 124 | Dihydrofolate reductase | DHFR | HGNC:2861 |
| 125 | Dicer 1, ribonuclease III | DICER1 | HGNC:17098 |
| 126 | DIS3 like 3'-5' exoribonuclease 2 | DIS3L2 | HGNC:28648 |
| 127 | DLC1 Rho GTPase activating protein | DLC1 | HGNC:2897 |
| 128 | DNA methyltransferase 1 | DNMT1 | HGNC:2976 |
| 129 | DNA methyltransferase 3 alpha | DNMT3A | HGNC:2978 |
| 130 | DNA methyltransferase 3 beta | DNMT3B | HGNC:2979 |
| 131 | Dihydropyrimidine dehydrogenase | DPYD | HGNC:3012 |
| 132 | Drosha ribonuclease III | DROSHA | HGNC:17904 |
| 133 | Desmoglein 2 | DSG2 | HGNC:3049 |
| 134 | Desmoplakin | DSP | HGNC:3052 |
| 135 | E2F transcription factor 1 | E2F1 | HGNC:3113 |
| 136 | E2F transcription factor 4 | E2F4 | HGNC:3118 |
| 137 | Ephrin A3 | EFNA3 | HGNC:3223 |
| 138 | Epidermal growth factor | EGF | HGNC:3229 |
| 139 | Epidermal growth factor receptor | EGFR | HGNC:3236 |
| 140 | ELAV like RNA binding protein 1 | ELAVL1 | HGNC:3312 |
| 141 | Endoglin | ENG | HGNC:3349 |
| 142 | EP300 lysine acetyltransferase | EP300 | HGNC:3373 |
| 143 | Epithelial cell adhesion molecule | EPCAM | HGNC:11529 |
| 144 | EPH receptor A2 | EPHA2 | HGNC:3386 |
| 145 | EPH receptor B2 | EPHB2 | HGNC:3393 |
| 146 | EPH receptor B4 | EPHB4 | HGNC:3395 |
| 147 | erb-b2 receptor tyrosine kinase 2 | ERBB2 | HGNC:3430 |
| 148 | erb-b2 receptor tyrosine kinase 3 | ERBB3 | HGNC:3431 |
| 149 | erb-b2 receptor tyrosine kinase 4 | ERBB4 | HGNC:3432 |
| 150 | ERCC excision repair 1, endonuclease non-catalytic subunit | ERCC1 | HGNC:3433 |
| 151 | ERCC excision repair 2, TFIIH core complex helicase subunit | ERCC2 | HGNC:3434 |
| 152 | ERCC excision repair 3, TFIIH core complex helicase subunit | ERCC3 | HGNC:3435 |
| 153 | ERCC excision repair 4, endonuclease catalytic subunit | ERCC4 | HGNC:3436 |
| 154 | ERCC excision repair 5, endonuclease | ERCC5 | HGNC:3437 |
| 155 | ERCC excision repair 6, chromatin remodeling factor | ERCC6 | HGNC:3438 |
| 156 | Endogenous retrovirus group 48 member 1, envelope | ERVH48-1 | HGNC:17216 |
| 157 | Estrogen receptor 2 | ESR2 | HGNC:3468 |
| 158 | ETS proto-oncogene 1, transcription factor | ETS1 | HGNC:3488 |
| 159 | Exocyst complex component 2 | EXOC2 | HGNC:24968 |
| 160 | Exostosin glycosyltransferase 1 | EXT1 | HGNC:3512 |
| 161 | Enhancer of zeste 2 polycomb repressive complex 2 subunit | EZH2 | HGNC:3527 |
| 162 | FA complementation group A | FANCA | HGNC:3582 |
| 163 | FA complementation group B | FANCB | HGNC:3583 |
| 164 | FA complementation group C | FANCC | HGNC:3584 |
| 165 | FA complementation group D2 | FANCD2 | HGNC:3585 |
| 166 | FA complementation group I | FANCI | HGNC:25568 |
| 167 | FA complementation group L | FANCL | HGNC:20748 |
| 168 | Fas cell surface death receptor | FAS | HGNC:11920 |
| 169 | Fas ligand | FASLG | HGNC:11936 |
| 170 | Fatty acid synthase | FASN | HGNC:3594 |
| 171 | Fibrillin 1 | FBN1 | HGNC:3603 |
| 172 | F-box protein 32 | FBXO32 | HGNC:16731 |
| 173 | F-box and WD repeat domain containing 7 | FBXW7 | HGNC:16712 |
| 174 | Fibroblast growth factor 2 | FGF2 | HGNC:3676 |
| 175 | Fibroblast growth factor receptor 1 | FGFR1 | HGNC:3688 |
| 176 | Fibroblast growth factor receptor 2 | FGFR2 | HGNC:3689 |
| 177 | Fibroblast growth factor receptor 3 | FGFR3 | HGNC:3690 |
| 178 | Fibroblast growth factor receptor 4 | FGFR4 | HGNC:3691 |
| 179 | Fumarate hydratase | FH | HGNC:3700 |
| 180 | Fragile histidine triad diadenosine triphosphatase | FHIT | HGNC:3701 |
| 181 | Folliculin | FLCN | HGNC:27310 |
| 182 | Fms related receptor tyrosine kinase 1 | FLT1 | HGNC:3763 |
| 183 | Fms related receptor tyrosine kinase 3 | FLT3 | HGNC:3765 |
| 184 | Fms related receptor tyrosine kinase 4 | FLT4 | HGNC:3767 |
| 185 | Fibronectin 1 | FN1 | HGNC:3778 |
| 186 | Fos proto-oncogene, AP-1 transcription factor subunit | FOS | HGNC:3796 |
| 187 | Forkhead box A1 | FOXA1 | HGNC:5021 |
| 188 | Forkhead box M1 | FOXM1 | HGNC:3818 |
| 189 | Forkhead box O1 | FOXO1 | HGNC:3819 |
| 190 | Forkhead box O3 | FOXO3 | HGNC:3821 |
| 191 | Polypeptide N-acetylgalactosaminyltransferase 12 | GALNT12 | HGNC:19877 |
| 192 | Growth arrest specific 5 | GAS5 | HGNC:16355 |
| 193 | GATA binding protein 2 | GATA2 | HGNC:4171 |
| 194 | GATA binding protein 3 | GATA3 | HGNC:4172 |
| 195 | Glutaminase | GLS | HGNC:4331 |
| 196 | GNAS complex locus | GNAS | HGNC:4392 |
| 197 | Gonadotropin releasing hormone 1 | GNRH1 | HGNC:4419 |
| 198 | Glypican 3 | GPC3 | HGNC:4451 |
| 199 | G protein-coupled estrogen receptor 1 | GPER1 | HGNC:4485 |
| 200 | G protein signaling modulator 2 | GPSM2 | HGNC:29501 |
| 201 | Growth factor receptor bound protein 2 | GRB2 | HGNC:4566 |
| 202 | Growth regulating estrogen receptor binding 1 | GREB1 | HGNC:24885 |
| 203 | Gremlin 1, DAN family BMP antagonist | GREM1 | HGNC:2001 |
| 204 | Glycogen synthase kinase 3 beta | GSK3B | HGNC:4617 |
| 205 | Glutathione S-transferase mu 1 | GSTM1 | HGNC:4632 |
| 206 | Glutathione S-transferase pi 1 | GSTP1 | HGNC:4638 |
| 207 | Glutathione S-transferase theta 1 | GSTT1 | HGNC:4641 |
| 208 | H19 imprinted maternally expressed transcript | H19 | HGNC:4713 |
| 209 | HOXD antisense growth-associated long non-coding RNA | HAGLR | HGNC:43755 |
| 210 | Histone deacetylase 1 | HDAC1 | HGNC:4852 |
| 211 | Histone deacetylase 4 | HDAC4 | HGNC:14063 |
| 212 | Homeostatic iron regulator | HFE | HGNC:4886 |
| 213 | Hepatocyte growth factor | HGF | HGNC:4893 |
| 214 | Hypoxia inducible factor 1 subunit alpha | HIF1A | HGNC:4910 |
| 215 | HIF1A antisense RNA 2 | HIF1A-AS2 | HGNC:43015 |
| 216 | High mobility group AT-hook 2 | HMGA2 | HGNC:5009 |
| 217 | Hyaluronan mediated motility receptor | HMMR | HGNC:5012 |
| 218 | HNF1 homeobox A | HNF1A | HGNC:11621 |
| 219 | HOX transcript antisense RNA | HOTAIR | HGNC:33510 |
| 220 | HOXA cluster antisense RNA 2 | HOXA-AS2 | HGNC:43745 |
| 221 | Homeobox B13 | HOXB13 | HGNC:5112 |
| 222 | HR lysine demethylase and nuclear receptor corepressor | HR | HGNC:5172 |
| 223 | HRas proto-oncogene, GTPase | HRAS | HGNC:5173 |
| 224 | Hydroxysteroid 17-beta dehydrogenase 1 | HSD17B1 | HGNC:5210 |
| 225 | Heat shock protein 90 alpha family class A member 1 | HSP90AA1 | HGNC:5253 |
| 226 | Heat shock protein family B (small) member 1 | HSPB1 | HGNC:5246 |
| 227 | Intercellular adhesion molecule 1 | ICAM1 | HGNC:5344 |
| 228 | Isocitrate dehydrogenase (NADP(+)) 1 | IDH1 | HGNC:5382 |
| 229 | Isocitrate dehydrogenase (NADP(+)) 2 | IDH2 | HGNC:5383 |
| 230 | Interferon gamma | IFNG | HGNC:5438 |
| 231 | Insulin like growth factor 1 receptor | IGF1R | HGNC:5465 |
| 232 | Insulin like growth factor 2 | IGF2 | HGNC:5466 |
| 233 | Insulin like growth factor 2 receptor | IGF2R | HGNC:5467 |
| 234 | Insulin like growth factor binding protein 3 | IGFBP3 | HGNC:5472 |
| 235 | Interleukin 10 | IL10 | HGNC:5962 |
| 236 | Interleukin 12B | IL12B | HGNC:5970 |
| 237 | Interleukin 1 beta | IL1B | HGNC:5992 |
| 238 | Interleukin 1 receptor antagonist | IL1RN | HGNC:6000 |
| 239 | Interleukin 2 | IL2 | HGNC:6001 |
| 240 | Interleukin 6 | IL6 | HGNC:6018 |
| 241 | Interleukin 7 receptor | IL7R | HGNC:6024 |
| 242 | Inosine monophosphate dehydrogenase 1 | IMPDH1 | HGNC:6052 |
| 243 | Insulin | INS | HGNC:6081 |
| 244 | Interferon regulatory factor 1 | IRF1 | HGNC:6116 |
| 245 | Insulin receptor substrate 1 | IRS1 | HGNC:6125 |
| 246 | Itchy E3 ubiquitin protein ligase | ITCH | HGNC:13890 |
| 247 | Integrin subunit beta 1 | ITGB1 | HGNC:6153 |
| 248 | Janus kinase 1 | JAK1 | HGNC:6190 |
| 249 | Janus kinase 2 | JAK2 | HGNC:6192 |
| 250 | Jun proto-oncogene, AP-1 transcription factor subunit | JUN | HGNC:6204 |
| 251 | KCNQ1 opposite strand/antisense transcript 1 | KCNQ1OT1 | HGNC:6295 |
| 252 | Lysine demethylase 4B | KDM4B | HGNC:29136 |
| 253 | Lysine demethylase 6A | KDM6A | HGNC:12637 |
| 254 | Kinase insert domain receptor | KDR | HGNC:6307 |
| 255 | Kelch like ECH associated protein 1 | KEAP1 | HGNC:23177 |
| 256 | KiSS-1 metastasis suppressor | KISS1 | HGNC:6341 |
| 257 | KIT proto-oncogene, receptor tyrosine kinase | KIT | HGNC:6342 |
| 258 | KIT ligand | KITLG | HGNC:6343 |
| 259 | kinesin light chain 1 | KLC1 | HGNC:6387 |
| 260 | KLF3 antisense RNA 1 | KLF3-AS1 | HGNC:25796 |
| 261 | KLF transcription factor 4 | KLF4 | HGNC:6348 |
| 262 | KLF transcription factor 6 | KLF6 | HGNC:2235 |
| 263 | Kallikrein related peptidase 3 | KLK3 | HGNC:6364 |
| 264 | Lysine methyltransferase 2A | KMT2A | HGNC:7132 |
| 265 | Lysine methyltransferase 2C | KMT2C | HGNC:13726 |
| 266 | Lysine methyltransferase 2D | KMT2D | HGNC:7133 |
| 267 | KRas proto-oncogene, GTPase | KRAS | HGNC:6407 |
| 268 | Keratin 18 | KRT18 | HGNC:6430 |
| 269 | Keratin 19 | KRT19 | HGNC:6436 |
| 270 | Keratin 20 | KRT20 | HGNC:20412 |
| 271 | Keratin 5 | KRT5 | HGNC:6442 |
| 272 | Keratin 7 | KRT7 | HGNC:6445 |
| 273 | Keratin 8 | KRT8 | HGNC:6446 |
| 274 | Lymphocyte cytosolic protein 1 | LCP1 | HGNC:6528 |
| 275 | Low density lipoprotein receptor | LDLR | HGNC:6547 |
| 276 | Lymphoid enhancer binding factor 1 | LEF1 | HGNC:6551 |
| 277 | Leptin | LEP | HGNC:6553 |
| 278 | Leptin receptor | LEPR | HGNC:6554 |
| 279 | Long independently transcribed non-coding RNA 472 | LINC00472 | HGNC:21380 |
| 280 | Long independently transcribed non-coding RNA 1116 | LINC01116 | HGNC:49259 |
| 281 | LDL receptor related protein 1B | LRP1B | HGNC:6693 |
| 282 | Lung cancer associated transcript 1 | LUCAT1 | HGNC:48498 |
| 283 | Metastasis associated lung adenocarcinoma transcript 1 | MALAT1 | HGNC:29665 |
| 284 | Mitogen-activated protein kinase kinase 1 | MAP2K1 | HGNC:6840 |
| 285 | Mitogen-activated protein kinase kinase 2 | MAP2K2 | HGNC:6842 |
| 286 | Mitogen-activated protein kinase kinase 4 | MAP2K4 | HGNC:6844 |
| 287 | Mitogen-activated protein kinase kinase kinase 1 | MAP3K1 | HGNC:6848 |
| 288 | Mitogen-activated protein kinase kinase kinase 6 | MAP3K6 | HGNC:6858 |
| 289 | Mitogen-activated protein kinase 1 | MAPK1 | HGNC:6871 |
| 290 | Mitogen-activated protein kinase 10 | MAPK10 | HGNC:6872 |
| 291 | Mitogen-activated protein kinase 14 | MAPK14 | HGNC:6876 |
| 292 | Mitogen-activated protein kinase 8 | MAPK8 | HGNC:6881 |
| 293 | MYC associated transcriptional regulator X | MAX | HGNC:6913 |
| 294 | Melanocortin 1 receptor | MC1R | HGNC:6929 |
| 295 | Melanocortin 4 receptor | MC4R | HGNC:6932 |
| 296 | MCL1 apoptosis regulator, BCL2 family member | MCL1 | HGNC:6943 |
| 297 | MDM2 proto-oncogene | MDM2 | HGNC:6973 |
| 298 | MDM4 regulator of p53 | MDM4 | HGNC:6974 |
| 299 | Mediator complex subunit 1 | MED1 | HGNC:9234 |
| 300 | Mediator complex subunit 12 | MED12 | HGNC:11957 |
| 301 | Maternally expressed 3 | MEG3 | HGNC:14575 |
| 302 | Maternal embryonic leucine zipper kinase | MELK | HGNC:16870 |
| 303 | Menin 1 | MEN1 | HGNC:7010 |
| 304 | MET proto-oncogene, receptor tyrosine kinase | MET | HGNC:7029 |
| 305 | O-6-methylguanine-DNA methyltransferase | MGMT | HGNC:7059 |
| 306 | Myocardial infarction associated transcript | MIAT | HGNC:33425 |
| 307 | microRNA 106b | MIR106B | HGNC:31495 |
| 308 | microRNA 10b | MIR10B | HGNC:31498 |
| 309 | microRNA 125a | MIR125A | HGNC:31505 |
| 310 | microRNA 126 | MIR126 | HGNC:31508 |
| 311 | microRNA 127 | MIR127 | HGNC:31509 |
| 312 | microRNA 132 | MIR132 | HGNC:31516 |
| 313 | microRNA 135b | MIR135B | HGNC:31760 |
| 314 | microRNA 139 | MIR139 | HGNC:31526 |
| 315 | microRNA 141 | MIR141 | HGNC:31528 |
| 316 | microRNA 143 | MIR143 | HGNC:31530 |
| 317 | microRNA 146a | MIR146A | HGNC:31533 |
| 318 | microRNA 149 | MIR149 | HGNC:31536 |
| 319 | microRNA 15a | MIR15A | HGNC:31543 |
| 320 | microRNA 15b | MIR15B | HGNC:31544 |
| 321 | microRNA 17 | MIR17 | HGNC:31547 |
| 322 | microRNA 182 | MIR182 | HGNC:31553 |
| 323 | microRNA 183 | MIR183 | HGNC:31554 |
| 324 | microRNA 192 | MIR192 | HGNC:31562 |
| 325 | microRNA 196b | MIR196B | HGNC:31790 |
| 326 | microRNA 200a | MIR200A | HGNC:31578 |
| 327 | microRNA 200b | MIR200B | HGNC:31579 |
| 328 | microRNA 200c | MIR200C | HGNC:31580 |
| 329 | microRNA 20a | MIR20A | HGNC:31577 |
| 330 | microRNA 21 | MIR21 | HGNC:31586 |
| 331 | microRNA 210 | MIR210 | HGNC:31587 |
| 332 | microRNA 22 | MIR22 | HGNC:31599 |
| 333 | microRNA 221 | MIR221 | HGNC:31601 |
| 334 | microRNA 24-1 | MIR24-1 | HGNC:31607 |
| 335 | microRNA 25 | MIR25 | HGNC:31609 |
| 336 | microRNA 30a | MIR30A | HGNC:31624 |
| 337 | microRNA 30b | MIR30B | HGNC:31625 |
| 338 | microRNA 30e | MIR30E | HGNC:31629 |
| 339 | microRNA 320a | MIR320A | HGNC:31632 |
| 340 | microRNA 342 | MIR342 | HGNC:31778 |
| 341 | microRNA 34a | MIR34A | HGNC:31635 |
| 342 | microRNA 34b | MIR34B | HGNC:31636 |
| 343 | microRNA 34c | MIR34C | HGNC:31637 |
| 344 | microRNA 424 | MIR424 | HGNC:31881 |
| 345 | microRNA 425 | MIR425 | HGNC:31882 |
| 346 | microRNA 494 | MIR494 | HGNC:32084 |
| 347 | microRNA 497 | MIR497 | HGNC:32088 |
| 348 | microRNA 542 | MIR542 | HGNC:32534 |
| 349 | MIR7-3 host gene | MIR7-3HG | HGNC:30049 |
| 350 | microRNA 92a-1 | MIR92A1 | HGNC:31643 |
| 351 | microRNA 93 | MIR93 | HGNC:31645 |
| 352 | microRNA 96 | MIR96 | HGNC:31648 |
| 353 | microRNA 98 | MIR98 | HGNC:31649 |
| 354 | microRNA 99a | MIR99A | HGNC:31650 |
| 355 | microRNA let-7b | MIRLET7B | HGNC:31479 |
| 356 | microRNA let-7d | MIRLET7D | HGNC:31481 |
| 357 | microRNA let-7e | MIRLET7E | HGNC:31482 |
| 358 | microRNA let-7g | MIRLET7G | HGNC:31485 |
| 359 | Melanocyte inducing transcription factor | MITF | HGNC:7105 |
| 360 | Marker of proliferation Ki-67 | MKI67 | HGNC:7107 |
| 361 | MutL homolog 1 | MLH1 | HGNC:7127 |
| 362 | MutL homolog 3 | MLH3 | HGNC:7128 |
| 363 | Matrix metallopeptidase 1 | MMP1 | HGNC:7155 |
| 364 | Matrix metallopeptidase 14 | MMP14 | HGNC:7160 |
| 365 | Matrix metallopeptidase 2 | MMP2 | HGNC:7166 |
| 366 | Matrix metallopeptidase 7 | MMP7 | HGNC:7174 |
| 367 | Matrix metallopeptidase 9 | MMP9 | HGNC:7176 |
| 368 | MRE11 double strand break repair nuclease | MRE11 | HGNC:7230 |
| 369 | MutS homolog 2 | MSH2 | HGNC:7325 |
| 370 | MutS homolog 6 | MSH6 | HGNC:7329 |
| 371 | Macrophage scavenger receptor 1 | MSR1 | HGNC:7376 |
| 372 | Metastasis associated 1 | MTA1 | HGNC:7410 |
| 373 | Methylenetetrahydrofolate reductase | MTHFR | HGNC:7436 |
| 374 | Mechanistic target of rapamycin kinase | MTOR | HGNC:3942 |
| 375 | 5-methyltetrahydrofolate-homocysteine methyltransferase | MTR | HGNC:7468 |
| 376 | Mucin 1, cell surface associated | MUC1 | HGNC:7508 |
| 377 | Mucin 16, cell surface associated | MUC16 | HGNC:15582 |
| 378 | MAX interactor 1, dimerization protein | MXI1 | HGNC:7534 |
| 379 | MYB proto-oncogene, transcription factor | MYB | HGNC:7545 |
| 380 | MYC proto-oncogene, bHLH transcription factor | MYC | HGNC:7553 |
| 381 | N-acetyltransferase 2 | NAT2 | HGNC:7646 |
| 382 | Nibrin | NBN | HGNC:7652 |
| 383 | Nuclear receptor coactivator 3 | NCOA3 | HGNC:7670 |
| 384 | Nuclear receptor corepressor 1 | NCOR1 | HGNC:7672 |
| 385 | Nuclear receptor corepressor 2 | NCOR2 | HGNC:7673 |
| 386 | Nuclear paraspeckle assembly transcript 1 | NEAT1 | HGNC:30815 |
| 387 | NIMA related kinase 2 | NEK2 | HGNC:7745 |
| 388 | neurofibromin 1 | NF1 | HGNC:7765 |
| 389 | NFE2 like bZIP transcription factor 2 | NFE2L2 | HGNC:7782 |
| 390 | Nuclear factor kappa B subunit 1 | NFKB1 | HGNC:7794 |
| 391 | NFKB inhibitor alpha | NFKBIA | HGNC:7797 |
| 392 | NK2 homeobox 1 | NKX2-1 | HGNC:11825 |
| 393 | NME/NM23 nucleoside diphosphate kinase 1 | NME1 | HGNC:7849 |
| 394 | NNT antisense RNA 1 | NNT-AS1 | HGNC:49005 |
| 395 | Nitric oxide synthase 2 | NOS2 | HGNC:7873 |
| 396 | Notch receptor 1 | NOTCH1 | HGNC:7881 |
| 397 | Notch receptor 2 | NOTCH2 | HGNC:7882 |
| 398 | Notch receptor 3 | NOTCH3 | HGNC:7883 |
| 399 | Nucleophosmin 1 | NPM1 | HGNC:7910 |
| 400 | NAD(P)H quinone dehydrogenase 1 | NQO1 | HGNC:2874 |
| 401 | N-ribosyldihydronicotinamide:quinone dehydrogenase 2 | NQO2 | HGNC:7856 |
| 402 | Nuclear receptor subfamily 3 group C member 1 | NR3C1 | HGNC:7978 |
| 403 | NRAS proto-oncogene, GTPase | NRAS | HGNC:7989 |
| 404 | Neuregulin 1 | NRG1 | HGNC:7997 |
| 405 | Nth like DNA glycosylase 1 | NTHL1 | HGNC:8028 |
| 406 | Neurotrophic receptor tyrosine kinase 1 | NTRK1 | HGNC:8031 |
| 407 | Neurotrophic receptor tyrosine kinase 2 | NTRK2 | HGNC:8032 |
| 408 | Neurotrophic receptor tyrosine kinase 3 | NTRK3 | HGNC:8033 |
| 409 | Ornithine decarboxylase 1 | ODC1 | HGNC:8109 |
| 410 | 8-oxoguanine DNA glycosylase | OGG1 | HGNC:8125 |
| 411 | Phenylalanine hydroxylase | PAH | HGNC:8582 |
| 412 | p21 (RAC1) activated kinase 1 | PAK1 | HGNC:8590 |
| 413 | Partner and localizer of BRCA2 | PALB2 | HGNC:26144 |
| 414 | Palladin, cytoskeletal associated protein | PALLD | HGNC:17068 |
| 415 | Poly(ADP-ribose) polymerase 1 | PARP1 | HGNC:270 |
| 416 | Polybromo 1 | PBRM1 | HGNC:30064 |
| 417 | Polycomb group ring finger 2 | PCGF2 | HGNC:12929 |
| 418 | Proliferating cell nuclear antigen | PCNA | HGNC:8729 |
| 419 | Programmed cell death 1 | PDCD1 | HGNC:8760 |
| 420 | Platelet derived growth factor subunit B | PDGFB | HGNC:8800 |
| 421 | Platelet derived growth factor receptor alpha | PDGFRA | HGNC:8803 |
| 422 | Prohibitin 1 | PHB1 | HGNC:8912 |
| 423 | Paired like homeobox 2B | PHOX2B | HGNC:9143 |
| 424 | Phosphatidylinositol-4,5-bisphosphate 3-kinase catalytic subunit alpha | PIK3CA | HGNC:8975 |
| 425 | Phosphatidylinositol-4,5-bisphosphate 3-kinase catalytic subunit beta | PIK3CB | HGNC:8976 |
| 426 | Phosphatidylinositol-4,5-bisphosphate 3-kinase catalytic subunit delta | PIK3CD | HGNC:8977 |
| 427 | Phosphatidylinositol-4,5-bisphosphate 3-kinase catalytic subunit gamma | PIK3CG | HGNC:8978 |
| 428 | Phosphoinositide-3-kinase regulatory subunit 1 | PIK3R1 | HGNC:8979 |
| 429 | Phosphoinositide-3-kinase regulatory subunit 2 | PIK3R2 | HGNC:8980 |
| 430 | Pyruvate kinase M1/2 | PKM | HGNC:9021 |
| 431 | Plasminogen activator, urokinase | PLAU | HGNC:9052 |
| 432 | Plasminogen activator, urokinase receptor | PLAUR | HGNC:9053 |
| 433 | Polo like kinase 1 | PLK1 | HGNC:9077 |
| 434 | PML nuclear body scaffold | PML | HGNC:9113 |
| 435 | PMS1 homolog 1, mismatch repair system component | PMS1 | HGNC:9121 |
| 436 | PMS1 homolog 2, mismatch repair system component | PMS2 | HGNC:9122 |
| 437 | DNA polymerase delta 1, catalytic subunit | POLD1 | HGNC:9175 |
| 438 | DNA polymerase epsilon, catalytic subunit | POLE | HGNC:9177 |
| 439 | Protection of telomeres 1 | POT1 | HGNC:17284 |
| 440 | POU class 5 homeobox 1 | POU5F1 | HGNC:9221 |
| 441 | Peroxisome proliferator activated receptor gamma | PPARG | HGNC:9236 |
| 442 | Protein phosphatase, Mg2+/Mn2+ dependent 1D | PPM1D | HGNC:9277 |
| 443 | Protein phosphatase, Mg2+/Mn2+ dependent 1L | PPM1L | HGNC:16381 |
| 444 | Protein phosphatase 2 scaffold subunit Abeta | PPP2R1B | HGNC:9303 |
| 445 | Protein phosphatase 2 regulatory subunit Balpha | PPP2R2A | HGNC:9304 |
| 446 | Protein regulator of cytokinesis 1 | PRC1 | HGNC:9341 |
| 447 | Protein kinase cAMP-activated catalytic subunit alpha | PRKACA | HGNC:9380 |
| 448 | Protein kinase cAMP-dependent type I regulatory subunit alpha | PRKAR1A | HGNC:9388 |
| 449 | Protein kinase C alpha | PRKCA | HGNC:9393 |
| 450 | Protein kinase, DNA-activated, catalytic subunit | PRKDC | HGNC:9413 |
| 451 | Parkin RBR E3 ubiquitin protein ligase | PRKN | HGNC:8607 |
| 452 | Prolactin receptor | PRLR | HGNC:9446 |
| 453 | Phosphatase and tensin homolog | PTEN | HGNC:9588 |
| 454 | Prostaglandin F receptor | PTGFR | HGNC:9600 |
| 455 | Prostaglandin-endoperoxide synthase 2 | PTGS2 | HGNC:9605 |
| 456 | Parathyroid hormone like hormone | PTHLH | HGNC:9607 |
| 457 | Protein tyrosine kinase 2 | PTK2 | HGNC:9611 |
| 458 | Protein tyrosine phosphatase non-receptor type 11 | PTPN11 | HGNC:9644 |
| 459 | Protein tyrosine phosphatase non-receptor type 3 | PTPN3 | HGNC:9655 |
| 460 | RAB, member of RAS oncogene family like 3 | RABL3 | HGNC:18072 |
| 461 | Rac family small GTPase 1 | RAC1 | HGNC:9801 |
| 462 | RAD50 double strand break repair protein | RAD50 | HGNC:9816 |
| 463 | RAD51 recombinase | RAD51 | HGNC:9817 |
| 464 | RAD51 paralog B | RAD51B | HGNC:9822 |
| 465 | RAD51 paralog C | RAD51C | HGNC:9820 |
| 466 | RAD54 like | RAD54L | HGNC:9826 |
| 467 | Raf-1 proto-oncogene, serine/threonine kinase | RAF1 | HGNC:9829 |
| 468 | Retinoic acid receptor alpha | RARA | HGNC:9864 |
| 469 | Ras association domain family member 1 | RASSF1 | HGNC:9882 |
| 470 | RB transcriptional corepressor 1 | RB1 | HGNC:9884 |
| 471 | RB1 inducible coiled-coil 1 | RB1CC1 | HGNC:15574 |
| 472 | RB binding protein 8, endonuclease | RBBP8 | HGNC:9891 |
| 473 | Reversion inducing cysteine rich protein with kazal motifs | RECK | HGNC:11345 |
| 474 | RecQ like helicase | RECQL | HGNC:9948 |
| 475 | RecQ like helicase 4 | RECQL4 | HGNC:9949 |
| 476 | RELA proto-oncogene, NF-kB subunit | RELA | HGNC:9955 |
| 477 | RE1 silencing transcription factor | REST | HGNC:9966 |
| 478 | Ret proto-oncogene | RET | HGNC:9967 |
| 479 | Rhomboid 5 homolog 2 | RHBDF2 | HGNC:20788 |
| 480 | Ras homolog family member A | RHOA | HGNC:667 |
| 481 | Rho related BTB domain containing 2 | RHOBTB2 | HGNC:18756 |
| 482 | RAD50 interactor 1 | RINT1 | HGNC:21876 |
| 483 | Receptor interacting serine/threonine kinase 1 | RIPK1 | HGNC:10019 |
| 484 | Rhabdomyosarcoma 2 associated transcript | RMST | HGNC:29893 |
| 485 | Ribonuclease L | RNASEL | HGNC:10050 |
| 486 | Ring finger protein 43 | RNF43 | HGNC:18505 |
| 487 | Ribosomal protein S6 kinase B1 | RPS6KB1 | HGNC:10436 |
| 488 | RUNX family transcription factor 1 | RUNX1 | HGNC:10471 |
| 489 | S100 calcium binding protein A4 | S100A4 | HGNC:10494 |
| 490 | Succinate dehydrogenase complex flavoprotein subunit A | SDHA | HGNC:10680 |
| 491 | Succinate dehydrogenase complex assembly factor 2 | SDHAF2 | HGNC:26034 |
| 492 | Succinate dehydrogenase complex iron sulfur subunit B | SDHB | HGNC:10681 |
| 493 | Succinate dehydrogenase complex subunit C | SDHC | HGNC:10682 |
| 494 | Succinate dehydrogenase complex subunit D | SDHD | HGNC:10683 |
| 495 | Septin 9 | SEPTIN9 | HGNC:7323 |
| 496 | Serpin family E member 1 | SERPINE1 | HGNC:8583 |
| 497 | SET domain containing 2, histone lysine methyltransferase | SETD2 | HGNC:18420 |
| 498 | SHC adaptor protein 1 | SHC1 | HGNC:10840 |
| 499 | S-phase kinase associated protein 2 | SKP2 | HGNC:10901 |
| 500 | Solute carrier family 19 member 1 | SLC19A1 | HGNC:10937 |
| 501 | Solute carrier family 2 member 1 | SLC2A1 | HGNC:11005 |
| 502 | Solute carrier family 39 member 6 | SLC39A6 | HGNC:18607 |
| 503 | SLX4 structure-specific endonuclease subunit | SLX4 | HGNC:23845 |
| 504 | SMAD family member 2 | SMAD2 | HGNC:6768 |
| 505 | SMAD family member 3 | SMAD3 | HGNC:6769 |
| 506 | SMAD family member 4 | SMAD4 | HGNC:6770 |
| 507 | SMAD family member 7 | SMAD7 | HGNC:6773 |
| 508 | SWI/SNF related BAF chromatin remodeling complex subunit ATPase 4 | SMARCA4 | HGNC:11100 |
| 509 | SWI/SNF related BAF chromatin remodeling complex subunit B1 | SMARCB1 | HGNC:11103 |
| 510 | SWI/SNF related BAF chromatin remodeling complex subunit E1 | SMARCE1 | HGNC:11109 |
| 511 | Smoothened, frizzled class receptor | SMO | HGNC:11119 |
| 512 | Snail family transcriptional repressor 1 | SNAI1 | HGNC:11128 |
| 513 | Snail family transcriptional repressor 2 | SNAI2 | HGNC:11094 |
| 514 | Small nucleolar RNA host gene 1 | SNHG1 | HGNC:32688 |
| 515 | Small nucleolar RNA host gene 12 | SNHG12 | HGNC:30062 |
| 516 | Small nucleolar RNA host gene 15 | SNHG15 | HGNC:27797 |
| 517 | Small nucleolar RNA host gene 7 | SNHG7 | HGNC:28254 |
| 518 | Suppressor of cytokine signaling 1 | SOCS1 | HGNC:19383 |
| 519 | Superoxide dismutase 2 | SOD2 | HGNC:11180 |
| 520 | SRY-box transcription factor 2 | SOX2 | HGNC:11195 |
| 521 | SOX2 overlapping transcript | SOX2-OT | HGNC:20209 |
| 522 | SRY-box transcription factor 9 | SOX9 | HGNC:11204 |
| 523 | Sp1 transcription factor | SP1 | HGNC:11205 |
| 524 | Spen family transcriptional repressor | SPEN | HGNC:17575 |
| 525 | Secreted phosphoprotein 1 | SPP1 | HGNC:11255 |
| 526 | ST8SIA6 antisense RNA 1 | ST8SIA6-AS1 | HGNC:44880 |
| 527 | STAG2 cohesin complex component | STAG2 | HGNC:11355 |
| 528 | Signal transducer and activator of transcription 1 | STAT1 | HGNC:11362 |
| 529 | Signal transducer and activator of transcription 3 | STAT3 | HGNC:11364 |
| 530 | Signal transducer and activator of transcription 5B | STAT5B | HGNC:11367 |
| 531 | Steroid sulfatase | STS | HGNC:11425 |
| 532 | STXBP5 antisense RNA 1 | STXBP5-AS1 | HGNC:44183 |
| 533 | SUFU negative regulator of hedgehog signaling | SUFU | HGNC:16466 |
| 534 | T-box transcription factor 3 | TBX3 | HGNC:11602 |
| 535 | Transcription factor 7 like 2 | TCF7L2 | HGNC:11641 |
| 536 | TEK receptor tyrosine kinase | TEK | HGNC:11724 |
| 537 | Telomerase reverse transcriptase | TERT | HGNC:11730 |
| 538 | Transforming growth factor alpha | TGFA | HGNC:11765 |
| 539 | Transforming growth factor beta 1 | TGFB1 | HGNC:11766 |
| 540 | Transforming growth factor beta 2 | TGFB2 | HGNC:11768 |
| 541 | Transforming growth factor beta receptor 1 | TGFBR1 | HGNC:11772 |
| 542 | Transforming growth factor beta receptor 3 | TGFBR3 | HGNC:11774 |
| 543 | Thrombospondin 1 | THBS1 | HGNC:11785 |
| 544 | TIMP metallopeptidase inhibitor 1 | TIMP1 | HGNC:11820 |
| 545 | TIMP metallopeptidase inhibitor 2 | TIMP2 | HGNC:11821 |
| 546 | TIMP metallopeptidase inhibitor 3 | TIMP3 | HGNC:11822 |
| 547 | Toll like receptor 4 | TLR4 | HGNC:11850 |
| 548 | Transmembrane protein 127 | TMEM127 | HGNC:26038 |
| 549 | Tumor necrosis factor | TNF | HGNC:11892 |
| 550 | TNF receptor superfamily member 10b | TNFRSF10B | HGNC:11905 |
| 551 | TNF superfamily member 10 | TNFSF10 | HGNC:11925 |
| 552 | Tankyrase | TNKS | HGNC:11941 |
| 553 | DNA topoisomerase I | TOP1 | HGNC:11986 |
| 554 | DNA topoisomerase II alpha | TOP2A | HGNC:11989 |
| 555 | DNA topoisomerase II beta | TOP2B | HGNC:11990 |
| 556 | Tumor protein p53 | TP53 | HGNC:11998 |
| 557 | Tumor protein p53 binding protein 1 | TP53BP1 | HGNC:11999 |
| 558 | Tumor protein p63 | TP63 | HGNC:15979 |
| 559 | Tumor protein p73 | TP73 | HGNC:12003 |
| 560 | Trophoblast glycoprotein | TPBG | HGNC:12004 |
| 561 | Tropomyosin 1 | TPM1 | HGNC:12010 |
| 562 | TNF receptor associated factor 5 | TRAF5 | HGNC:12035 |
| 563 | Tripartite motif containing 24 | TRIM24 | HGNC:11812 |
| 564 | TSC complex subunit 1 | TSC1 | HGNC:12362 |
| 565 | TSC complex subunit 2 | TSC2 | HGNC:12363 |
| 566 | Tumor susceptibility 101 | TSG101 | HGNC:15971 |
| 567 | Thyroid stimulating hormone receptor | TSHR | HGNC:12373 |
| 568 | Tubulin beta class I | TUBB | HGNC:20778 |
| 569 | Taurine up-regulated 1 | TUG1 | HGNC:26066 |
| 570 | Twist family bHLH transcription factor 1 | TWIST1 | HGNC:12428 |
| 571 | Thymidine phosphorylase | TYMP | HGNC:3148 |
| 572 | Thymidylate synthetase | TYMS | HGNC:12441 |
| 573 | Urothelial cancer associated 1 | UCA1 | HGNC:37126 |
| 574 | Ubiquitin interaction motif containing 1 | UIMC1 | HGNC:30298 |
| 575 | Vitamin D receptor | VDR | HGNC:12679 |
| 576 | Vascular endothelial growth factor A | VEGFA | HGNC:12680 |
| 577 | Vascular endothelial growth factor C | VEGFC | HGNC:12682 |
| 578 | von Hippel-Lindau tumor suppressor | VHL | HGNC:12687 |
| 579 | Vimentin | VIM | HGNC:12692 |
| 580 | WEE1 G2 checkpoint kinase | WEE1 | HGNC:12761 |
| 581 | Wnt family member 5A | WNT5A | HGNC:12784 |
| 582 | WD repeat containing antisense to TP53 | WRAP53 | HGNC:25522 |
| 583 | WRN RecQ like helicase | WRN | HGNC:12791 |
| 584 | WT1 transcription factor | WT1 | HGNC:12796 |
| 585 | WW domain containing oxidoreductase | WWOX | HGNC:12799 |
| 586 | X-box binding protein 1 | XBP1 | HGNC:12801 |
| 587 | X-linked inhibitor of apoptosis | XIAP | HGNC:592 |
| 588 | X inactive specific transcript | XIST | HGNC:12810 |
| 589 | XPA, DNA damage recognition and repair factor | XPA | HGNC:12814 |
| 590 | XPC complex subunit, DNA damage recognition and repair factor | XPC | HGNC:12816 |
| 591 | X-ray repair cross complementing 1 | XRCC1 | HGNC:12828 |
| 592 | X-ray repair cross complementing 2 | XRCC2 | HGNC:12829 |
| 593 | X-ray repair cross complementing 3 | XRCC3 | HGNC:12830 |
| 594 | Yes1 associated transcriptional regulator | YAP1 | HGNC:16262 |
| 595 | Zinc finger E-box binding homeobox 1 | ZEB1 | HGNC:11642 |
| 596 | Zinc finger E-box binding homeobox 2 | ZEB2 | HGNC:14881 |
| 597 | ZNFX1 antisense RNA 1 | ZFAS1 | HGNC:33101 |
| 598 | Zinc finger homeobox 3 | ZFHX3 | HGNC:777 |
| 599 | Zinc finger protein 226 | ZNF226 | HGNC:13019 |
| 600 | Apurinic/apyrimidinic endodeoxyribonuclease 1 | APEX1 | HGNC:587 |
| S. no. | Gene | Degree | Betweenness | Closeness |
|---|---|---|---|---|
| 1 | TP53 | 20 | 36.55488 | 0.9166667 |
| 2 | CTNNB1 | 17 | 22.947418 | 0.8148148 |
| 3 | STAT3 | 16 | 35.14751 | 0.78571427 |
| 4 | EP300 | 15 | 6.983542 | 0.7586207 |
| 5 | BRCA1 | 15 | 8.865761 | 0.7586207 |
| 6 | JUN | 15 | 6.3675547 | 0.7586207 |
| 7 | HDAC1 | 14 | 7.10359 | 0.73333335 |
| 8 | SMAD3 | 14 | 11.143892 | 0.73333335 |
| 9 | FOXO3 | 14 | 9.667524 | 0.73333335 |
| 10 | EGFR | 14 | 30.097809 | 0.73333335 |
| 11 | HIF1A | 13 | 4.958153 | 0.7096774 |
| 12 | CREBBP | 13 | 3.048002 | 0.7096774 |
| 13 | HSP90AA1 | 13 | 14.258073 | 0.7096774 |
| 14 | CDK2 | 13 | 6.858516 | 0.6875 |
| 15 | SMAD2 | 11 | 5.4929295 | 0.6666667 |
| 16 | CDK4 | 11 | 5.385622 | 0.64705884 |
| 17 | SMARCA4 | 10 | 3.1275735 | 0.62857145 |
| 18 | ATM | 10 | 4.311977 | 0.6111111 |
| 19 | GRB2 | 7 | 6.6081953 | 0.5945946 |
| 20 | CDKN1B | 7 | 4.7634 | 0.5945946 |
| 21 | PTPN11 | 6 | 3.5929294 | 0.5641026 |
| 22 | CD44 | 6 | 0.7151515 | 0.57894737 |
| 23 | SHC1 | 4 | 0 | 0.5 |
| S. no. | Compound | Degree | Betweenness | Closeness |
|---|---|---|---|---|
| 1 | Norcepharadione B | 16 | 0.044930636 | 0.569231 |
| 2 | Piperine | 10 | 0.007306859 | 0.480519 |
| 3 | Aristolodione | 18 | 0.084677764 | 0.606557 |
| 4 | Aristolactam BII | 12 | 0.021652833 | 0.506849 |
| 5 | Piperlongumine | 11 | 0.017921943 | 0.493333 |
| 6 | Pluviatilol | 15 | 0.034154909 | 0.55223881 |
| 7 | Aristololactam | 12 | 0.032323994 | 0.506849 |
| 8 | Fargesin | 11 | 0.012610539 | 0.49333333 |
| 9 | Pellitorine | 20 | 0.163497384 | 0.64912281 |
| 10 | Aristolactam AII | 18 | 0.085932008 | 0.60655738 |
| 11 | Piperettine | 10 | 0.007306859 | 0.48051948 |
| 12 | Asarinine | 11 | 0.012222268 | 0.49333333 |
| 13 | Demethoxypiplartine | 10 | 0.015304632 | 0.480519 |
| 14 | N-isobutyl decadienamide | 15 | 0.058820693 | 0.552239 |
| 15 | Sesamin | 11 | 0.01244779 | 0.493333 |
| S. no. | Protein-ligand complex | Predicted docking scores (kcal/mol) |
|---|---|---|
| 1 | TP53_Norcepharadione B | −6.7 |
| 2 | TP53_Aristolodione | −7.1 |
| 3 | TP53_Pellitorine | −5.1 |
| 4 | TP53_Aristolactam AII | −6.6 |
| 5 | TP53_N-isobutyl decadienamide | −5.8 |
| 6 | CTNNB1_Norcepharadione B | −6.4 |
| 7 | CTNNB1_Aristolodione | −6.9 |
| 8 | CTNNB1_Pellitorine | −4.8 |
| 9 | CTNNB1_Aristolactam AII | −6.3 |
| 10 | CTNNB1_N-isobutyl decadienamide | −5.6 |
| 11 | HSP90AA1_Norcepharadione B | −10.9 |
| 12 | HSP90AA1_Aristolodione | −10.3 |
| 13 | HSP90AA1_Pellitorine | −7.5 |
| 14 | HSP90AA1_Aristolactam AII | −10.7 |
| 15 | HSP90AA1_N-isobutyl decadienamide | −9 |
| 16 | SMAD3_Norcepharadione B | −7 |
| 17 | SMAD3_Aristolodione | −6.7 |
| 18 | SMAD3_Pellitorine | −5.2 |
| 19 | SMAD3_Aristolactam AII | −6.6 |
| 20 | SMAD3_N-isobutyl decadienamide | −6.3 |
| 21 | STAT3_Norcepharadione B | −7.2 |
| 22 | STAT3_Aristolodione | −7.6 |
| 23 | STAT3_Pellitorine | −5.5 |
| 24 | STAT3_Aristolactam AII | −6.9 |
| 25 | STAT3_N-isobutyl decadienamide | −6.5 |
| 26 | EGFR_Norcepharadione B | −8.9 |
| 27 | EGFR_Aristolodione | −9.1 |
| 28 | EGFR_Pellitorine | −5.3 |
| 29 | EGFR_Aristolactam AII | −8.4 |
| 30 | EGFR_N-isobutyl decadienamide | −6.4 |
| Extract concentration | Proliferation percentages | Mean | Standard deviation | ||
|---|---|---|---|---|---|
| Replicate 1 | Replicate 2 | Replicate 3 | |||
| Blank | 100 | 100 | 100 | 100 | 0 |
| 0.25 μg/mL | 96.07 | 98.87 | 99.97 | 98.3033333 | 2.01080415 |
| 0.5 μg/mL | 99.29 | 98.43 | 94.76 | 97.4933333 | 2.40587475 |
| 1 μg/mL | 98.81 | 99.06 | 94.42 | 97.43 | 2.60973179 |
| 2.5 μg/mL | 99.46 | 98.37 | 88.76 | 95.53 | 5.888268 |
| 3.75 μg/mL | 47.66 | 49.17 | 52.19 | 49.6733333 | 2.3065631 |
| 5 μg/mL | 39.48 | 41.1 | 37.89 | 39.49 | 1.60502336 |
| 7.5 μg/mL | 3.71 | 4.42 | 5.91 | 4.68 | 1.12280898 |
| 10 μg/mL | 3.35 | 5.06 | 10.55 | 6.32 | 3.76174162 |
| 12.5 μg/mL | 3.75 | 6.44 | 8.06 | 6.08333333 | 2.17702396 |
| 15 μg/mL | 3.1 | 3.18 | 5.73 | 4.00333333 | 1.4958721 |
| 20 μg/mL | 1.04 | 9.72 | 2.56 | 4.44 | 4.63534249 |
| 25 μg/mL | 4.03 | 6.42 | 1.76 | 4.07 | 2.3302575 |
| 30 μg/mL | 7.94 | 4.03 | 2.19 | 4.72 | 2.93644343 |
| 50 μg/mL | 5.89 | 4.39 | 3.87 | 4.71666667 | 1.04887241 |