Translate this page into:
Association of Happiness and Life Satisfaction with Cancer Mortality in the United States: A Longitudinal Analysis
✉Corresponding author email: hyunjung.lee0001@gmail.com
-
Received: ,
Accepted: ,
This article was originally published by Global Health and Education Projects, Inc. and was migrated to Scientific Scholar after the change of Publisher.
Abstract
Background:
The impact of happiness and life satisfaction on cancer mortality is not well studied. Using a longitudinal dataset, we examined the association between levels of happiness/life satisfaction and cancer mortality in the United States.
Methods:
We analyzed the 2001 National Health Interview Survey (NHIS) prospectively linked to 2001-2014 mortality records in the National Death Index (NDI) (N=30,933). Cox proportional hazards regression was used to model survival time as a function of happiness, life satisfaction, and sociodemographic and behavioral characteristics.
Results:
In Cox models with 14 years of mortality follow-up, cancer mortality risk was 78% higher (hazard ratio [HR]=1.78; 95% CI=1.42,2.23) in adults with little or no happiness, controlling for age, and 53% higher (HR=1.53; 95% CI=1.19,1.97) in adults with little/no happiness, controlling for sociodemographic, behavioral and health characteristics, when compared with adults reporting happiness most or all of the time. Age- adjusted cancer mortality risk increased by 41% (HR=1.41; 95% CI=1.21,1.77) in adults who were very dissatisfied with their life. Cancer mortality did not vary by life satisfaction after adjusting for all covariates.
Conclusions and Implications for Translation:
Adults with lower happiness levels had significantly higher cancer mortality risks than those with higher happiness levels. Excess mortality was substantially accounted for by sociodemographic, behavioral, and health risk factors.
Keywords
Happiness
Life satisfaction
Cancer
Mortality
Longitudinal
Social determinants

1. Introduction
Cancer is the second leading cause of death in the United States and globally, and is responsible for an estimated 600,000 deaths in the US and 9.6 million deaths globally.1,2 Race/ethnicity, socioeconomic status (SES), smoking, diet, alcohol use, obesity, physical inactivity, reproductive behavior, occupational and environmental exposures, human papillomavirus (HPV) and Helicobacter pylori infections, limited cancer screening, and reduced access to health care are well-known risk factors for cancer outcomes.3 However, the association of cancer with another possible risk factor, subjective well-being, measured by happiness and life satisfaction, is not well studied. Despite being one of the wealthiest nations, the US ranks lower than 17 other countries in happiness and life satisfaction.4,5 Happiness and life satisfaction have been shown to be protective factors for physical health, morbidity, and mortality.5-10 However, studies examining the association between subjective well-being and cancer mortality are limited, particularly in the US.7 To address this gap in research on cancer, we examined the association between happiness/ life satisfaction and US cancer mortality by using longitudinal data and by considering a wide range of sociodemographic, behavioral, and health risk factors.
2. Methods
The data source for this study was the 2001 National Health Interview Survey (NHIS) prospectively linked to the death certificate data from the National Death Index (NDI).11 NHIS is a nationally representative, cross-sectional household interview survey that provides socio-economic, demographic, and health characteristics of the US civilian, non-institutionalized population. We used the public-use linked NHIS-NDI mortality file, developed by the National Center for Health Statistics, that includes mortality follow-up from the date of survey participation in 2001 through December 31,2014.12
The study sample consisted of 31,376 adults aged ≥18 years in the 2001 NHIS sample adult file. The sample ineligible for mortality follow-up was eliminated from the analysis. Approximately 1.41% of the sample had missing data on happiness and life satisfaction, which were also excluded from the analysis. The final eligible sample size was 30,933. All covariates except poverty status had <1.8% of missing cases. About 21.7% of the cases had missing data on poverty status for which we included a covariate category in the analysis to avoid losing a large number of observations.
Our outcome of interest was cancer mortality (ICD-10 codes C00-C97). Follow-up time for individuals who died was defined by the number of months from the month/year of interview to the month/year of death. Since NHIS-NDI provides only the quarter of death, we assumed that death occurred in the middle of the quarter, February, May, August, or November.
The independent variables were happiness and life satisfaction. The level of happiness was measured by responses to the question, “During the past 30 days, how often did you feel happy?” Happiness was categorized by none or a little of the time, some of the time, and most or all of the time. Life satisfaction was measured by responses to the question, “In general, how satisfied are you with your life?” Life satisfaction was categorized by very dissatisfied or dissatisfied, satisfied, and very satisfied.
Based on previous research, we selected the following covariates for modeling: age, gender, race/ethnicity, nativity/immigrant status, marital status, social support, education, poverty status, homeownership, region, activity limitation, body mass index (BMI), smoking status, and alcohol use.5,6
We computed age-adjusted mortality rates per 100,000 person-years of exposure by happiness and life satisfaction levels.13 Cox proportional hazards regression models were used to derive relative risks of mortality, controlling for individual characteristics.13 Individuals surviving beyond the follow-up period and those dying from other causes were treated as right-censored observations. All analyses were conducted by Stata 15, accounting for complex survey design effects.14
3. Results
Approximately 4.5% of the sample responded that they felt happy none or a little of the time during the past 30 days. About 5.9% of the sample responded that they were very dissatisfied or dissatisfied with their life in general. Women reported lower levels of happiness and life satisfaction than men (Table 1).
| Sample size | Cox model HR (95% ci) | |||
|---|---|---|---|---|
| Observations (weighted %) | Age-adjusted model1 | SES-adjusted model2 | Fully-adjusted model3 | |
| Both sexes combined | ||||
| Cancer deaths | 1,305 | |||
| Happiness | 30,933 | 30,933 | ||
| None / a little of the time | 1,575 (4.46) | I.78***4 (1.42,2.23) | 1.68*** (1.34,2.11) | 1.53*** (1.19,1.97) |
| Some of the time | 5,603 (16.88) | 1.18* (0.99,1.4) | 1.16* (0.98,1.38) | 1.11 (0.92,1.35) |
| Most or all of the time | 23,755 (78.65) | 1.00 (Reference) | 1.00 (Reference) | 1.00 (Reference) |
| Life satisfaction5 | 30,928 | 30,928 | ||
| Very dissatisfied or dissatisfied | 2,109 (5.92) | 1.41*** (1.12,1.77) | 1.26* (0.99,1.60) | 1.13 (0.87,1.47) |
| Satisfied | 16,115 (50.20) | 1.09 (0.95,1.25) | 1.05 (0.92,1.21) | 1.03 (0.89,1.19) |
| Very satisfied | 12,704 (43.88) | 1.00 (Reference) | 1.00 (Reference) | 1.00 (Reference) |
| Male | ||||
| Happiness | 13,463 | 13,463 | ||
| None / a little of the time | 649 (4.21) | 2.02*** (1.49,2.74) | 1.93*** (1.42,2.61) | 1.90*** (1.37,2.63) |
| Some of the time | 2,352 (16.36) | 1.20 (0.94,1.53) | 1.20 (0.94,1.53) | 1.25 (0.96,1.63) |
| Most or all of the time | 10,462 (79.43) | 1.00 (Reference) | 1.00 (Reference) | 1.00 (Reference) |
| Life satisfaction | 13,462 | 13,462 | ||
| Very dissatisfied or dissatisfied | 868 (5.64) | 1.63*** (1.18,2.26) | 1.41* (1.00,1.97) | 1.33 (0.94,1.88) |
| Satisfied | 6,959 (49.98) | 1.03 (0.85,1.25) | 0.98 (0.81,1.19) | 0.99 (0.81,1.20) |
| Very satisfied | 5,635 (44.38) | I.00 (Reference) | I.00 (Reference) | I.00 (Reference) |
| Female | ||||
| Happiness | 17,470 | 17,470 | ||
| None / a little of the time | 926 (4.69) | 1.54** (1.09,2.18) | 1.35* (0.95,1.93) | 1.13 (0.78,1.65) |
| Some of the time | 3,251 (17.37) | 1.23* (0.97,1.55) | 1.13 (0.90,1.42) | 1.00 (0.77,1.29) |
| Most or all of the time | 13,293 (77.94) | 1.00 (Reference) | 1.00 (Reference) | 1.00 (Reference) |
| Life satisfaction | 17,466 | 17,466 | ||
| Very dissatisfied or dissatisfied | 1,241 (6.17) | 1.38* (1,1.92) | 1.13 (0.80,1.61) | 0.94 (0.65,1.37) |
| Satisfied | 9,156 (50.41) | 1.25** (1.04,1.51) | 1.16 (0.96,1.4) | 1.08 (0.88,1.33) |
| Very satisfied | 7,069 (43.42) | I.00 (Reference) | I.00 (Reference) | I.00 (Reference) |
Data derived from the 2001-2014 NHIS-NDI Record Linkage Study. CI=Confidence interval. 1Cox proportional hazards models were adjusted for age. 2Cox models were adjusted for age, gender race/ethnicity nativity/immigrant status, marital status, education, poverty status, housing tenure, and region of residence. 3Cox models were adjusted for all variables in Model 2 plus social support, activity limitation, BMI, smoking status, and alcohol consumption. 4Hazard ratios were statistically significantly different from 1. ***p<0.01; **p<0.05; *p<0.I0. 5Cox models for life satisfaction and for other covariates were separately estimated but coefficients of life satisfaction are being reported in the same table
Adults with lower levels of happiness and life satisfaction had higher age-adjusted cancer mortality rates (Figure 1). The cancer mortality rate for adults with “none or a little of the time” happiness was 444.0 deaths per 100,000 person-years, 55% higher than the mortality rate of 287.3 for adults with “most or all of the time” happiness. The cancer mortality rate for adults who were very dissatisfied or dissatisfied with their life was 26% higher than the rate for those who were very satisfied.
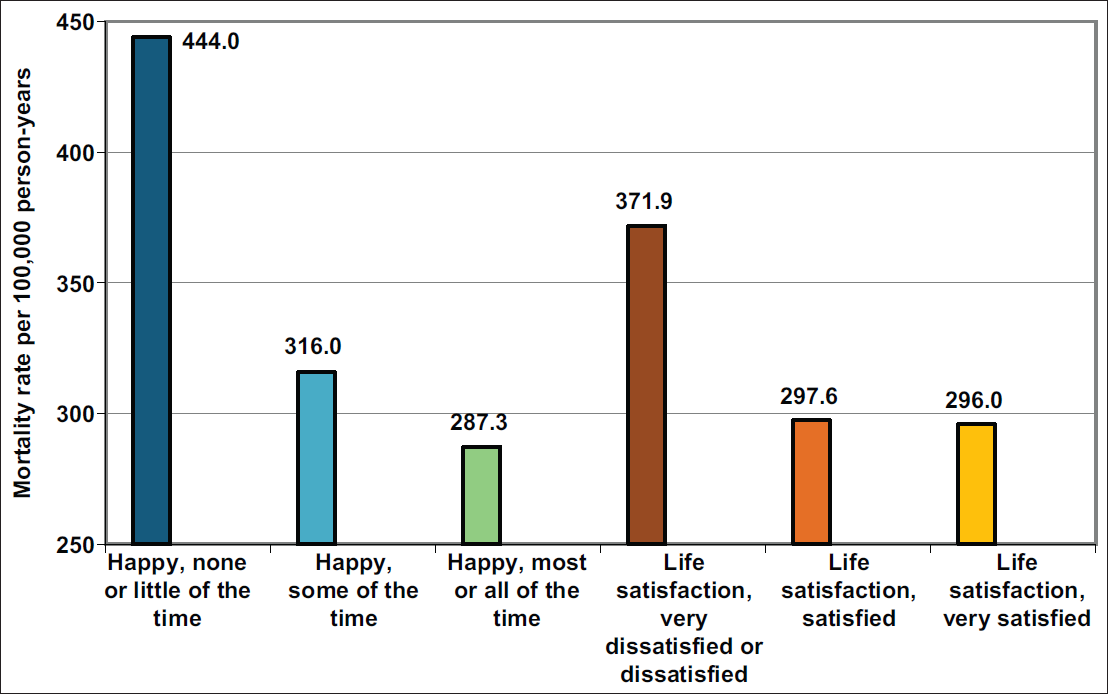
- Age-Adjusted Cancer Mortality Rates per 100,000 Person-Years by Levels of Happiness and Life Satisfaction, United States, 2001-2014
- Source: Data derived from the 2001-2014 NHIS-NDI Record Linkage Study. The mortality rate ratio between low and high happiness levels, none/little of the time and most/all of the time was RR = 1.55; 95% CI = 1.23,1.86; p<0.01. The mortality rate ratio between low and high life satisfaction levels, was RR = 1.26; 95% CI = 1.00,1.52; p<0.05
In Cox models, the age-adjusted cancer mortality risk was 78% higher (hazard ratio [HR]=1.78; 95% 0=1.42,2.23) in adults with “none or a little of the time” happiness, compared with adults with “most or all of the time” happiness (Table 1, Model 1). After controlling for socioeconomic and demographic covariates, the mortality risk was 68% higher (HR=1.68; 95% CI=1.34,2.11) in adults with “none or a little of the time” happiness, compared with adults with “most or all of the time” happiness (Table 1, Model 2). After controlling for all covariates, the mortality risk was 53% higher (HR=1.53; 95% CI=1.19,1.97) in adults with “none or a little of the time” happiness, compared to those with “most or all of the time” happiness (Table 1, Model 3).
In Cox models, the age-adjusted cancer mortality risk was 41% higher (HR=1.41; 95% CI=1.12,1.77) among adults who were very dissatisfied or dissatisfied with their life, compared with adults who were very satisfied (Table 1, Model 1). After controlling for socioeconomic and demographic covariates, the cancer mortality risk was 26% higher (HR=1.26; 95% CI=0.99,1.60) in adults who were very dissatisfied or dissatisfied, compared with adults who were very satisfied (Table 1, Model 2). After controlling for all covariates, cancer mortality did not vary by life satisfaction (Table 1, Model 3). The association between happiness and fully-adjusted cancer mortality risks was stronger for men than for women (Table 1).
We tested the issue of reverse causality by comparing the analysis between the samples with and without baseline histories of cancer diagnoses. We found in the fully-adjusted models no association between life satisfaction and cancer mortality for both respondents with and without cancer. While the association between happiness and cancer mortality was statistically significant among both samples, the effect sizes were greater for individuals with cancer history (HR=2.09; 95% CI=1.27,3.44, p<0.01 for those with cancer history; HR=1.27; 95% CI=0.96,1.68, p<0.10 for those without cancer history) [Table 2].
| Age-adjusted model | SES-adjusted model | Fully-adjusted model | |
|---|---|---|---|
| Adults without the cancer diagnosis at baseline | |||
| Happiness | 28,732 | 28,732 | 28,732 |
| None / a little of the time | 1.59*** (1.22,2.08) | 1.47*** (1.12,1.92) | 1.27* (0.96,1.68) |
| Some of the time | 1.06 (0.87,1.30) | 1.04 (0.85,1.27) | 0.95 (0.76,1.19) |
| Most or all of the time | 1.00 (Reference) | 1.00 (Reference) | 1.00 (Reference) |
| Life satisfaction | 28,729 | 28,729 | 28,729 |
| Very dissatisfied or dissatisfied | 1.43*** (1.10,1.85) | 1.25* (0.96,1.64) | 1.07 (0.79,1.44) |
| Satisfied | 1.10 (0.94,1.29) | 1.06 (0.90,1.24) | 1.01 (0.86,1.20) |
| Very satisfied | 1.00 (Reference) | 1.00 (Reference) | 1.00 (Reference) |
| Adults with the cancer diagnosis at baseline | |||
| Happiness | 2,201 | 2,201 | 2,201 |
| None / a little of the time | 2.13*** (1.43,3.16) | 2.04*** (1.34,3.10) | 2.09*** (1.27,3.44) |
| Some of the time | 1.42** (1.05,1.93) | 1.38** (1.02,1.86) | 1.44** (1.05,1.99) |
| Most or all of the time | 1.00 (Reference) | 1.00 (Reference) | 1.00 (Reference) |
| Life satisfaction | 2,199 | 2,199 | 2,199 |
| Very dissatisfied or dissatisfied | 1.22 (0.77,1.94) | 1.15 (0.72,1.84) | 1.16 (0.69,1.97) |
| Satisfied | 1.07 (0.83,1.37) | 1.02 (0.78,1.32) | 1.04 (0.78,1.39) |
| Very satisfied | 1.00 (Reference) | 1.00 (Reference) | 1.00 (Reference) |
Data derived from the 2001-2014 NHIS-NDI Record Linkage Study. ***p<0.01; **p<0.05; *p<0.10
We conducted sensitivity analyses to evaluate temporal robustness of happiness/life satisfaction by re-estimating models using 2-year, 5-year, and 10- year follow-up times. The longer follow-up dilutes the mortality impact of baseline happiness and life satisfaction, as they are expected to differ from their baseline levels over the longer follow-up (Table 3).
| Age-adjusted model | SES-adjusted model | Fully-adjusted model | |
|---|---|---|---|
| 2-Year mortality follow-up | |||
| Happiness | |||
| None / a little of the time | 2.30*** (1.27,4.18) | 2.27*** (1.23,4.19) | 2.53*** (1.28,5.02) |
| Some of the time | 2.06*** (1.40,3.01) | 2.06*** (1.39,3.04) | 2.15*** (1.39,3.33) |
| Most or all of the time | 1.00 (Reference) | 1.00 (Reference) | 1.00 (Reference) |
| Life satisfaction | |||
| Very dissatisfied or dissatisfied | 1.92** (1.05,3.51) | 1.74* (0.93,3.25) | 1.83* (0.92,3.65) |
| Satisfied | 1.21 (0.85,1.72) | 1.18 (0.82,1.71) | 1.19 (0.81,1.75) |
| Very satisfied | 1.00 (Reference) | 1.00 (Reference) | 1.00 (Reference) |
| 5-Year mortality follow-up | |||
| Happiness | |||
| None / a little of the time | 2.33*** (1.65,3.29) | 2.23*** (1.55,3.20) | 2.17*** (1.47,3.21) |
| Some of the time | 1.40** (1.07,1.83) | 1.39** (1.06,1.83) | 1.40** (1.04,1.88) |
| Most or all of the time | 1.00 (Reference) | 1.00 (Reference) | 1.00 (Reference) |
| Life satisfaction | |||
| Very dissatisfied or dissatisfied | 1.65*** (1.15,2.36) | 1.48* (1.00,2.19) | 1.41 (0.91,2.17) |
| Satisfied | 1.04 (0.83,1.30) | 1.02 (0.82,1.28) | 1.03 (0.81,1.32) |
| Very satisfied | 1.00 (Reference) | 1.00 (Reference) | 1.00 (Reference) |
| 10-Year mortality follow-up | |||
| Happiness | |||
| None / a little of the time | 2.01*** (1.52,2.65) | 1.93*** (1.44,2.57) | 1.8*** (1.33,2.44) |
| Some of the time | 1.19* (0.97,1.46) | 1.20* (0.98,1.47) | 1.16 (0.93,1.45) |
| Most or all of the time | 1.00 (Reference) | 1.00 (Reference) | 1.00 (Reference) |
| Life satisfaction | |||
| Very dissatisfied or dissatisfied | 1.48*** (1.12,1.96) | 1.34* (0.99,1.81) | 1.23 (0.89,1.69) |
| Satisfied | 1.05 (0.89,1.23) | 1.02 (0.86,1.20) | 1.01 (0.84,1.20) |
| Very satisfied | 1.00 (Reference) | 1.00 (Reference) | 1.00 (Reference) |
Source: Data derived from the 2001-2014 NHIS-NDI Record Linkage Study. ***p<0.01; **p<0.05; *p<0.10
4. Discussion
In this prospective study of 30,933 US adults using 14 years of mortality follow-up data, we found that adults with lower levels of happiness and life satisfaction Implies causality of age-adjusted cancer mortality. After controlling for several sociodemographic, health status, and behavioral characteristics, significantly higher risks of cancer mortality existed for adults who did not experience happiness, compared with those who reported happiness most or all of the time. No significant association was found between life satisfaction and cancer mortality after adjusting for covariates. Our study contributes to the empirical literature by showing an inverse relationship between happiness/ life satisfaction and cancer mortality.
Our study findings are compatible with those from previous studies.5,7-10 Martin-Maria and colleagues found that the pooled HR for the effect of subjective well-being, including happiness and life satisfaction, on all-cause mortality was 0.92 (95% CI=0.91,0.93) in their meta-analysis of 90 studies.7 One study found an association between unhappiness and cancer mortality among UK women aged 50-69 in the age- adjusted model (HR=1.13; 95% CI=1.08,1.18), but the association disappeared after adjustment for socioeconomic and health characteristics.8 We found similar patterns for women. The age-adjusted relative risk of cancer mortality associated with happiness was 1.54, which became statistically insignificant in the fully-adjusted model.
Our study shows a statistically significant link between happiness and cancer mortality, but does not shed light on behavioral or biological mechanisms through which happiness or life satisfaction might affect cancer mortality. One potential mechanism is that individuals with greater happiness/life satisfaction levels have healthier lifestyles, including greater physical activity, higher consumption of fruits and vegetables, less drinking or smoking, and more preventive care such as higher uptake of cancer screening, resulting in reduced morbidity and mortality risks.5 The other mechanism might involve biological processes of happiness relevant to health such as biomarker neuroendocrine, inflammation, carcinogenesis, metabolic, or allostatic load.5 There are many risk factors for happiness/life satisfaction, such as personality, genetics, stress exposure, social support or network, race/ethnicity, SES, marital status, physical activity, and health status.5 In our analysis, we controlled for several of these factors, which are associated with both happiness/ life satisfaction and cancer mortality in an expected manner.5,6 Further research is needed to examine differential associations between happiness or life satisfaction and cancer mortality by considering different pathways.
4.1. Limitations
This study has several limitations. First, residual confounding and reverse causality might have affected our study findings. While we controlled for self-reported health status, activity limitation, BMI, and smoking at baseline, there could have been other potential confounders such as neighborhood environments or periods of economic downturn. Chronic poor health itself may be a determinant of self-reported happiness and life satisfaction at the survey time. Although we controlled for several baseline health factors, the issue of reverse causation cannot be fully resolved. Second, NHIS's measures of happiness and life satisfaction might not capture all aspects of subjective well-being, including optimism, realization of personal potential and fulfillment of life goals or specific measures of happiness in such domains as marriage/family, jobs, and finances. Third, because the NHIS excludes the institutionalized population, who may have lower happiness/life satisfaction and higher mortality levels, cancer mortality risks associated with happiness/life satisfaction might have been underestimated. Fourth, deaths from specific cancer sites are not identified in the public-use NHIS-NDI database, which limits our analysis. Finally, all covariates in the NHIS-NDI database were time-invariant during the follow-up. Several covariates such as SES, health status, health- risk behaviors, and happiness/life satisfaction could have varied over the 14-year follow-up, which would have influenced their estimated impacts on cancer mortality.
5. Conclusions and Implications for Translation
With 14 years of mortality follow-up in a nationally representative study of 30,933 US adults aged ≥18 years, we found that people with low levels of happiness and life satisfaction had, respectively, 78% and 41% higher age-adjusted risks of cancer mortality compared to those with high levels of happiness and life satisfaction. The association between happiness and cancer mortality remained marked and statistically significant even after controlling for several sociodemographic, behavioral, and health characteristics. Our study findings indicate happiness and satisfaction to be an important predictor of cancer mortality; they underscore the significance of enhancing subjective well-being in the population as a potential strategy for reducing cancer mortality. Social determinants such as education, income, work status, job security, housing conditions, social support, social environment, and access to green spaces and quality health care are key to enhancing happiness and life satisfaction. Policies addressing these social determinants will not only promote happiness and well-being among people and but may also lead to reductions in cancer mortality.
Ethical Consideration
Conflict of interest:
The authors declare no conflict of interest.
Disclaimer:
The views expressed in this publication are solely the opinions of the authors and do not necessarily reflect the official policies of US Department of Health and Human Services, Health Resources and Services Administration, nor does mention of the department or agency names imply endorsement by the US Government.
Financial Disclosure:
The authors have no financial relationships relevant to this article to disclose.
Ethical approval:
The study was deemed exempt from Institutional Review Board approval as it utilized a de-identified public use dataset.
Funding source:
Dr. Hyunjung Lee was supported in part by an appointment to the Research Participation Program at the Health Resources & Services Administration - Office of Health Equity (HRSA-OHE) and Office of Planning, Analysis and Evaluation (HRSA-OPAE), administered by the Oak Ridge Institute for Science and Education (ORISE) through an interagency agreement between the US Department of Energy and HRSA.
References
- Fact Sheet: Cancer. https://www.who.int/news-room/fact-sheets/detail/cancer. Published September 12, 2018 (accessed )
- Socioeconomic and racial/ ethnic disparities in cancer mortality, incidence, and survival in the United States, 1950-2014: over six decades of changing patterns and widening inequalities. J Environ Public Health 2017:2819372. doi: 10.1155/2017/2819372
- [CrossRef] [PubMed] [Google Scholar]
- Happiness and health. Annu Rev Public Health. 2019;40(1):339-359. doi:10.1146/annurev- publhealth-040218-044150
- [CrossRef] [PubMed] [Google Scholar]
- Happiness and life satisfaction prospectively predict self-rated health, physical health, and the presence of limiting, long-term health conditions. Am J Health Promot. 2008;23(1):18-26. doi: 10.4278/ajhp.06l023l37
- [CrossRef] [PubMed] [Google Scholar]
- The impact of subjective well-being on mortality: a meta-analysis of longitudinal studies in the general population. Psychosom Med. 2017;79(5):565-575. doi: 10.1097/PSY0000000000000444
- [CrossRef] [PubMed] [Google Scholar]
- Lancet. 2016;387(10021):874-881. doi: 10.1016/S0140- 6736(15)01087-9
- [CrossRef] [PubMed]
- Happy people live longer: Subjective well-being contributes to health and longevity. Appl Psychol Health Well-Being doi: 10.1111/j.1758-0854.20l0.0l045.x
- [Google Scholar]
- Healthy happiness: effects of happiness on physical health and the consequences for preventive health care. J Happiness Stud. 2008;9(3):449-469. doi: 10.1007/s10902-006-9042-l
- [CrossRef] [Google Scholar]
- National health interview survey: version 6.4 [dataset]; 2019. IPUMS Health Surveys doi:https://doi.org/10.18128/ D070.V6.4 (accessed )
- [Google Scholar]
- Centers for Disease Control and Prevention. 2015 Public-Use Linked Mortality Files. National Center for Health Statistics 2015
- [Google Scholar]
- Life table techniques and their applications. In: Winsborough HH, ed. Studies in Population. Academic Press; 1987.
- [Google Scholar]
- Stata Corp (2017) Stata Statistical Software: Release 15. College Station, TX: StataCorp LLC;
- [Google Scholar]