Translate this page into:
Racial and Ethnic Disparities in the Mental Health Impact of the COVID-19 Pandemic in the United States: Analysis of 3 Million Americans from the National Health Interview Survey and Household Pulse Survey
✉Corresponding author email: Hyunjung Lee, hyunjung.lee0001@gmail.com
Abstract
Background:
During the coronavirus (COVID-19) pandemic, racial/ethnic minorities in the United States (US) experienced a disproportionate burden of COVID-19 mortality and hospitalization, job losses, food insecurity, and reduced healthcare access, resulting in increased mental health problems. Given heterogeneous findings on the impact of COVID-19 among racial/ethnic minorities, it is worthwhile to examine the differential effects of the pandemic on mental health by race/ethnicity.
Methods:
This study examines changes in mental health status among US adults aged ≥18 years before and during the pandemic. We pooled data from the 2019 National Health Interview Survey with the 2020-2021 Household Pulse Survey (N=2,980,511). Logistic regression was used for binary outcomes and linear regression was used for the composite Psychological Distress Index (PDI) measure derived from principal components analysis to estimate changes in mental health after controlling for sociodemographic characteristics.
Results:
Mental health status worsened during the pandemic compared to the pre-pandemic period. The adjusted predicted probabilities of having little interest increased from 3.29% in 2019 to 10.97% in 2020 and 11.28% in 2021. The adjusted predicted probabilities of being depressed increased from 2.69% in 2019 to 11.00% in 2020 and 11.21% in 2021. The adjusted predicted probabilities of feeling anxious increased from 3.95% in 2019 to 18.35% in 2020 and 16.96% in 2021. The adjusted predicted probabilities of worrying increased from 4.18% in 2019 to 13.15% in 2020 and 12.61% in 2021. The adjusted mean PDI score increased from 87.52 in 2019 to 103.18 in 2020 and 101.13 in 2021. In stratified models, Blacks, Hispanics, and Asians had higher odds of depression, anxiety, and worries, compared with non-Hispanic Whites. Asians experienced 10 times higher odds of depression and 15 times higher odds of anxiety in 2020 than their counterparts before the pandemic.
Conclusions and Implications for Translation:
US adults experienced a marked increase in mental health problems, including depression and anxiety, in 2020 and 2021, compared with their counterparts in 2019. Racial/ethnic disparities in mental health worsened during the pandemic.
Keywords
COVID-19
Mental Health
Depression
Anxiety
Worry
Psychological Distress Index
Racial/Ethnic Disparity
Worsening Health Disparity

Introduction
Since the first US case of coronavirus disease 2019 (COVID-19) was confirmed from samples taken on January 18, 2020 in Washington state,1 there had been 67,903,759 confirmed COVID-19 cases and 853,230 deaths in the third year of the pandemic, January 18, 2022.2 The pandemic has disproportionately affected racial and ethnic minorities and amplified health disparities. From March 2020 to January 2022, the cumulative COVID-19 hospitalization rate per 100,000 population was 1705.8 for American Indians and Alaska Natives (AIANs), 1248.0 for Black/African Americans, and 987.5 for Hispanic adults aged 25 years or older, compared with 670.6 for non-Hispanic White adults and 411.8 for Asians and Pacific Islanders.3 In 2020, the age-adjusted COVID-19 cumulative mortality rate per 100,000 population was 334.5 for AIANs, 237.9 for Black/African-Americans, 356.9 for Hawaiians and other Pacific Islanders, and 265.2 for Hispanic adults aged 25 years or older, compared with 116.4 for nonHispanic White adults and 110.9 for Asians.4
During the COVID-19 pandemic, people have experienced income losses, social isolation, reduced access to care, physical inactivity, food insecurity, and substance use, inducing physical and mental health problems.5-12 Racial/ethnic minorities and low-income individuals in particular experienced disproportionately greater impacts of COVID-19 in terms of higher social and health inequities. For example, non-Hispanic Blacks, Hispanics, and the other/multiple-race group had 1.30, 1.22, and 1.35 times higher odds of job-related income losses in 2020 than non-Hispanic Whites after controlling for sociodemographic characteristics.5 Low-income adults had 5.54 and 2.18 times higher odds of being uninsured and delayed mental healthcare in 2020 than high-income adults.6 The prevalence of food insecurity in 2020 was higher for non-Hispanic Blacks (21.7%), Hispanics (17.2%), and non-Hispanic other races (8.8%) than non-Hispanic Whites (7.1%).13
Given such stark disparities in COVID-19 mortality and social determinants of health, racial and ethnic minorities might have experienced a disproportionately higher risk of mental health problems, but the available research has yielded heterogeneous findings on racial/ethnic mental health disparities. Some studies on mental health status during the early pandemic period found that racial/ethnic minorities, particularly Hispanics, were more likely to experience depression, anxiety, suicidal thoughts, or fear of COVID-19.12,14-18 However, other studies found no statistically significant difference or, in fact, higher depression among non-Hispanics White adults.8,19-22 Mixed findings on racial/ethnic disparities in mental health might have arisen from the use of different methods, study periods, or study locations.
There have also been studies comparing changes in mental health status from the baseline (prepandemic) among racial/ethnic groups, instead of only using mental health status during the pandemic.15,23-26 Several studies found that the prevalence of psychological distress, including anxiety and depression, increased after the pandemic, but few studies have examined the differential effects of the pandemic by race and ethnicity.15,23-26 One study found that non-Hispanic Blacks, Hispanics, and Asians experienced a significant change in screening positive for anxiety disorders between 2019 and 2020, compared with non-Hispanic Whites, and Asians showed the highest increase.25 Other studies found that the increase in the prevalence of psychological distress was greater among Hispanics than any other racial/ethnic group, although the difference in the adjusted model was not statistically significant or unknown.15,26 To extend the existing literature on the differential effects of the pandemic by race/ethnicity, we estimated mental health status before and during the pandemic by race/ethnicity using nationally representative datasets from 2019 to 2021.
Methods
Data
The data for this study were derived from the 2020-2021 Household Pulse Survey (HPS) and the 2019 National Health Interview Survey (NHIS). HPS, a nationally representative online survey conducted by the US Census Bureau using a short-turnaround instrument, was initially developed on a weekly basis with three rounds of interviews for the same households in Phase 1; however, Phase 2 and Phase 3.1 through 3.3 of the HPS consisted of bi-weekly cross-sectional datasets.27 A two-weeks on, two- weeks off collection and dissemination approach was used from Phase 3.3.28 For this study, we dropped repeated cases from the same individual in Phase 1 and pooled data from the weeks 1 through 40 from all Phases during the pandemic from April 2020 through August 2021. NHIS is a nationally representative, annual cross-sectional household, inperson interview survey conducted by the Centers for Disease Control and Prevention's National Center for Health Statistics; it provides demographic, socioeconomic, and health characteristics of the civilian, non-institutionalized population in the US.29 We used the 2019 NHIS to measure pre-pandemic mental health status and the HPS to measure mental health status during the pandemic since HPS is only available from 2020 onwards.
Sample
The study sample comprised adults aged 18 and older in the HPS from April 2020 to December 2021 and adults in the 2019 NHIS. The final sample size varied by the outcome measure, ranging from 2,580,600 to 2,567,508 due to missing values, although the pooled sample size was 2,980,511. We created missing covariate categories to prevent listwise deletion of many observations from the analysis for variables with greater than or equal to 1% of missing values, including income (20.37%), housing tenure (16.26%), marital status (1.00%), employment status (1.04%), and health insurance status (15.22%).
Outcome Measurement (Dependent Variable)
We used five dependent variables: having little interest, feeling down, feeling nervous, worrying, and a combined measure of four symptoms. The first two depression-related measures are referred to as the Patient Health Questionnaire-2 (PHQ-2), and the latter two anxiety-related measures were called the Generalized Anxiety Disorder-2 (GAD- 2). In HPS and NHIS, respondents were asked: how often they have been bothered by 1) “having little interest or pleasure in doing things,” 2) “feeling down, depressed, or hopeless,” 3) “feeling nervous, anxious, or on edge,” 4) “not being able to stop or control worrying.” HPS measured PHQ-2 and GAD over the last one week prior to the survey, while NHIS measured those over the last two weeks. The variable was dichotomized with 0 for not at all, several days, more than half the days, and 1 for nearly every day.
The Psychological Distress Index (PDI), a combined measure of the mental health symptoms, was constructed using principal components analysis of PHQ-2 and GAD-2, based on previous studies.17,30,31 Each of the four symptoms of mental health status was scored on a four-point scale: not at all (1), several days (2), more than half the days (3), or nearly every day (4). The factor loadings for the PDI items were 0.87 for “no interest”, 0.89 for “anxiety”, 0.90 for “depression”, and 0.90 for “worry”. PDI had a high-reliability coefficient (Cronbach's alpha=0.91), and the proportion of total variance explained by the factor was 0.79. PDI was standardized with a mean of 100 and a standard deviation of 20. Higher scores on the PDI indicate higher levels of psychological distress.
Primary Variable of Interest (Independent Variable)
Our primary variable of interest was the change between the pre-pandemic period and during the pandemic period. The changes were measured using the “year” variable with three categories 2019, 2020, and 2021.
Covariates
Based on the previous literature and data availability, we selected the following covariates of mental health for model estimation: age, sex, race/ethnicity, education, household income, marital status, employment status, health insurance status, housing tenure, and region of residence.8,32,33 More information about the variable definition is available elsewhere.8,9
Analytic Approach
Logistic regression models were used for binary outcome measures to examine changes in mental health before and during the pandemic among all US adults, controlling for individual characteristics. Linear regression was used to model variations in PDI. Differential changes by race/ethnicity were estimated using stratified logistic and linear regression models by race/ethnicity. Statistical significance of the differential effects was estimated using a Hausman test after the seemingly unrelated estimation, suest, the estimation from all subgroups to be pooled together.34 Adjusted average marginal effects were calculated with delta-method standard errors, using the Stata margin command.35 All analyses were survey-weighted to account for non-response, occupancy of the housing unit counts, the number of adults within the housing unit, and disproportionate sampling of demographic characteristics.27,29 All analyses were conducted by Stata 17.35
Results
Higher proportions of non-Hispanic White and Asian adults with bachelor's and master's degrees or higher and annual household incomes of ≥$100,000, currently married, private insurance, and were homeowners or Northeast residents, compared with other racial/ethnic groups (data not shown).
During the COVID-19 pandemic, the adjusted predicted probabilities of having little interest in doing things increased from 3.29% in 2019 to 10.97% in 2020 and 11.28% in 2021, after controlling for sociodemographic characteristics (Table 1). The adjusted predicted probabilities of being depressed increased from 2.69% in 2019 to 11.00% in 2020 and 11.21% in 2021. The adjusted predicted probabilities of feeling anxious increased from 3.95% in 2019 to 18.35% in 2020 and 16.96% in 2021. The adjusted predicted probabilities of worrying increased from 4.18% in 2019 to 13.15% in 2020 and 12.61% in 2021. The adjusted mean PDI score increased from 87.52 in 2019 to 103.18 in 2020 and 101.13 in 2021.
All racial/ethnic groups showed worse mental health outcomes during the pandemic (Table 2). Non-Hispanic Whites experienced 3.57 times higher odds of having no interest, 4.39 times higher odds of depression, 5.43 times higher odds of anxiety, and 3.30 times higher odds of worrying in 2020 compared with the pre-pandemic period. In 2021, non-Hispanic Whites experienced higher odds of having no interest, depression, anxiety, and worrying by 3.66, 4.50, 4.83, and 3.14 times, respectively, compared with the pre-pandemic period. PDI for non-Hispanic Whites increased by 14.66 points in 2020 and 12.69 points in 2021, relative to the prepandemic period of 2019.
| Covariates | No Interest OR (95% CI) | Depression OR (95% CI) | Anxiety OR (95% CI) | Worries OR (95% CI) | PDI (95% CI) |
|---|---|---|---|---|---|
| Sample size | 2,576,152 | 2,578,045 | 2,580,600 | 2,577,579 | 2,567,508 |
| Year | |||||
| 2019 (Before Pandemic | Reference | Reference | Reference | Reference | Reference |
| 2020 (During Pandemic) | 3.75 (3.44,4.10) | 4.69 (4.25,5.18) | 5.78 (5.36,6.24) | 3.62 (3.35,3.91) | 15.66 (15.42,15.91) |
| 2021 (During Pandemic) | 3.88 (3.55,4.23) | 4.80 (4.34,5.3) | 5.23 (4.85,5.64) | 3.44 (3.19,3.71) | 13.61 (13.37,13.85) |
| Age, continuous | 0.99 (0.98,0.99) | 0.98 (0.98,0.98) | 0.98 (0.98,0.98) | 0.98 (0.98,0.98) | -0.16 (-0.17,-0.15) |
| Sex | |||||
| Male | Reference | Reference | Reference | Reference | Reference |
| Female | 1.10 (1.04,1.17) | 1.11 (1.06,1.18) | 1.40 (1.34,1.46) | 1.50 (1.42,1.57) | 2.48 (2.26,2.70) |
| Race/ethnicity | |||||
| Non-Hispanic White | Reference | Reference | Reference | Reference | Reference |
| Non-Hispanic Black | 0.83 (0.76,0.92) | 0.71 (0.65,0.77) | 0.60 (0.56,0.65) | 0.76 (0.70,0.83) | -2.22 (-2.60,-1.85) |
| Hispanic | 0.77 (0.71,0.83) | 0.76 (0.70,0.82) | 0.73 (0.68,0.77) | 0.74 (0.69,0.80) | -1.86 (-2.20,-1.52) |
| Non-Hispanic Asian | 0.67 (0.59,0.76) | 0.65 (0.58,0.74) | 0.49 (0.45,0.54) | 0.64 (0.57,0.72) | -2.88 (-3.29,-2.47) |
| Non-Hispanic other race | 1.28 (1.13,1.45) | 1.21 (1.07,1.37) | 1.06 (0.97,1.17) | 1.24 (1.10,1.39) | 1.17 (0.46,1.89) |
| Education | |||||
| Less than high school | 1.79 (1.58,2.03) | 1.56 (1.38,1.77) | 1.26 (1.14,1.40) | 1.60 (1.43,1.80) | 1.77 (1.20,2.33) |
| High school | 1.38 (1.26,1.51) | 1.21 (1.11,1.32) | 0.95 (0.89,1.01) | 1.18 (1.09,1.27) | 0.22 (-0.07,0.51) |
| Some college | 1.44 (1.33,1.57) | 1.31 (1.21,1.41) | 1.14 (1.08,1.20) | 1.28 (1.19,1.37) | 1.26 (0.99,1.53) |
| Bachelor's degree | 1.04 (0.96,1.13) | 1.01 (0.93,1.09) | 0.98 (0.93,1.04) | 1.00 (0.94,1.08) | 0.21 (-0.03,0.46) |
| Master's degree or higher | Reference | Reference | Reference | Reference | Reference |
| Household Income | |||||
| <$35,000 | 1.90 (1.71,2.11) | 2.17 (1.98,2.38) | 1.72 (1.59,1.86) | 1.97 (1.79,2.17) | 4.88 (4.49,5.27) |
| $35,000 - $49,999 | 1.54 (1.38,1.72) | 1.82 (1.63,2.04) | 1.43 (1.32,1.55) | 1.60 (1.45,1.76) | 2.90 (2.49,3.31) |
| $50,000 - $74,999 | 1.42 (1.28,1.59) | 1.55 (1.41,1.71) | 1.32 (1.23,1.43) | 1.48 (1.34,1.62) | 1.83 (1.50,2.16) |
| $75,000 - $99,999 | 1.21 (1.08,1.36) | 1.33 (1.19,1.48) | 1.21 (1.11,1.31) | 1.29 (1.16,1.44) | 0.96 (0.62,1.30) |
| ≥$100,000 | Reference | Reference | Reference | Reference | Reference |
| Missing | 1.01 (0.89,1.14) | 1.19 (1.07,1.33) | 1.03 (0.95,1.11) | 1.11 (0.99,1.23) | -0.49 (-0.92,-0.06) |
| Marital status | |||||
| Currently married | Reference | Reference | Reference | Reference | Reference |
| Widowed | 1.52 (1.32,1.76) | 1.60 (1.37,1.85) | 1.12 (1.00,1.25) | 1.22 (1.07,1.39) | 1.38 (0.79,1.96) |
| Divorced/separated | 1.62 (1.50,1.75) | 1.69 (1.56,1.82) | 1.44 (1.36,1.52) | 1.40 (1.31,1.51) | 3.12 (2.77,3.47) |
| Never married | 1.33 (1.24,1.44) | 1.35 (1.25,1.45) | 1.12 (1.06,1.19) | 1.08 (1.01,1.16) | 1.18 (0.86,1.49) |
| Missing | 1.21 (0.93,1.57) | 1.14 (0.87,1.51) | 1.50 (1.00,2.27) | 1.30 (0.80,2.11) | 2.06 (-0.04,4.17) |
| Employment status | |||||
| Employed | Reference | Reference | Reference | Reference | Reference |
| Not employed | 1.71 (1.61,1.81) | 1.77 (1.67,1.86) | 1.50 (1.43,1.57) | 1.63 (1.54,1.72) | 3.59 (3.31,3.88) |
| Missing | 1.79 (1.17,2.75) | 1.75 (1.10,2.78) | 1.45 (0.82,2.56) | 1.03 (0.57,1.85) | 2.30 (-0.41,5.02) |
| Insurance status | |||||
| Private insurance | Reference | Reference | Reference | Reference | Reference |
| Public insurance | 1.06 (0.99,1.13) | 1.10 (1.03,1.17) | 1.08 (1.02,1.14) | 1.09 (1.02,1.17) | 0.37 (0.06,0.69) |
| Uninsured | 1.31 (1.18,1.45) | 1.37 (1.25,1.50) | 1.20 (1.11,1.30) | 1.24 (1.13,1.35) | 1.03 (0.54,1.52) |
| Missing | 1.39 (1.22,1.59) | 1.43 (1.24,1.63) | 1.07 (0.95,1.20) | 1.03 (0.90,1.16) | 1.74 (1.33,2.16) |
| Housing tenure (home ownership) | |||||
| Owner | Reference | Reference | Reference | Reference | Reference |
| Renter | 1.22 (1.15,1.30) | 1.27 (1.19,1.35) | 1.28 (1.21,1.34) | 1.30 (1.23,1.38) | 1.79 (1.51,2.08) |
| Missing | 1.33 (1.10,1.61) | 1.22 (1.04,1.45) | 1.25 (1.10,1.42) | 1.45 (1.21,1.75) | 1.45 (0.66,2.23) |
| Region of residence | |||||
| Northeast | Reference | Reference | Reference | Reference | Reference |
| Midwest | 1.01 (0.94,1.09) | 1.01 (0.93,1.09) | 0.98 (0.93,1.04) | 1.02 (0.95,1.09) | 0.05 (-0.27,0.36) |
| South | 1.02 (0.93,1.12) | 0.96 (0.87,1.05) | 0.92 (0.86,0.99) | 0.91 (0.84,0.99) | -0.69 (-1.03,-0.36) |
| West | 1.01 (0.92,1.10) | 0.99 (0.91,1.08) | 0.99 (0.93,1.06) | 0.93 (0.86,1.01) | 0.07 (-0.27,0.41) |
| Average Predicted Probabilities (%) and Mean PDI Score | |||||
| 2019 (Before Pandemic) | 3.29 (3.05,3.54) | 2.69 (2.46,2.92) | 3.95 (3.68,4.22) | 4.18 (3.91,4.46) | 87.52 (87.33,87.70) |
| 2020 (During Pandemic) | 10.97 (10.73,11.22) | 11.00 (10.75,11.24) | 18.35 (18.07,18.63) | 13.15 (12.91,13.38) | 103.18 (103.07,103.29) |
| 2021 (During Pandemic) | 11.28 (11.02,11.53) | 11.21 (10.95,11.47) | 16.96 (16.70,17.23) | 1261 (12.38,12.84) | 101.13 (101.01,101.24) |
OR=Odds Ratio. CI=Confidence interval. Logistic regression was used for binary outcomes measures, and linear regression was used for PDI, adjusting for age, sex, race/ethnicity, education, household income, marital status, employment status, insurance status, housing tenure, and region of residence. Average predicted probability for each year was calculated using post-estimation of fully adjusted logistic regression model.
| Mental health measure | Non-Hispanic White | Non-Hispanic Black | Hispanics | Non-Hispanic Asian | Non-Hispanic other race |
|---|---|---|---|---|---|
| Sample Size1 | 1,956,088 | 183,674 | 226,511 | 118,438 | 91,441 |
| No Interest OR (95% CI) | |||||
| 2019 | Reference | Reference | Reference | Reference | Reference |
| 2020 | 3.57 (3.18,4.00) | 3.52 (2.76,4.48) | 4.09 (3.22,5.21) | 7.02 (4.24,11.61) | 3.39 (2.27,5.05) |
| 2021 | 3.66 (3.27,4.10) | 3.76 (2.94,4.82) | 4.18 (3.28,5.33) | 6.94 (4.18,11.52) | 3.78 (2.54,5.62) |
| Depression OR (95% CI) | |||||
| 2019 | Reference | Reference | Reference | Reference | Reference |
| 2020 | 4.39 (3.86,5.00) | 5.27 (4.12,6.74) | 4.91 (3.86,6.25) | 10.17 (5.71,18.11) | 4.16 (2.71,6.39) |
| 2021 | 4.50 (3.95,5.13) | 5.36 (4.17,6.88) | 4.99 (3.92,6.34) | 9.87 (5.54,17.6) | 4.60 (3.01,7.04) |
| Anxiety OR (95% CI) | |||||
| 2019 | Reference | Reference | Reference | Reference | Reference |
| 2020 | 5.43 (4.95,5.96) | 6.78 (5.28,8.70) | 6.03 (4.92,7.39) | 14.99 (8.80,25.52) | 5.97 (4.23,8.43) |
| 2021 | 4.83 (4.40,5.29) | 6.74 (5.25,8.64) | 5.53 (4.52,6.77) | 12.27 (7.18,20.97) | 5.54 (3.91,7.83) |
| Worries OR (95% CI) | |||||
| 2019 | Reference | Reference | Reference | Reference | Reference |
| 2020 | 3.30 (3.00,3.62) | 3.99 (3.11,5.12) | 3.93 (3.17,4.86) | 10.68 (6.96,16.39) | 3.26 (2.30,4.62) |
| 2021 | 3.14 (2.86,3.45) | 3.80 (2.96,4.88) | 3.80 (3.07,4.70) | 8.78 (5.70,13.52) | 3.29 (2.32,4.66) |
| PDI (95% CI) | |||||
| 2019 | Reference | Reference | Reference | Reference | Reference |
| 2020 | 14.66 (14.35,14.96) | 16.26 (15.50,17.02) | 17.81 (17.15,18.48) | 16.70 (15.98,17.42) | 17.98 (16.37,19.59) |
| 2021 | 12.69 (12.39,12.99) | 14.21 (13.45,14.97) | 15.70 (15.04,16.36) | 13.89 (13.18,14.6) | 16.90 (15.30,18.51) |
OR=Odds Ratio. CI=Confidence interval. 1Sample size varies by outcome measure. Logistic regression was used for binary outcomes measures, and linear regression was used for PDI, adjusting for age, sex, education, household income, marital status, employment status, insurance status, housing tenure, and region of residence. Differential effects on each outcome measure for all racial/ethnic groups were statistically significant at Р<0.001, using Hausman test.
Non-Hispanic Blacks experienced 3.52 times higher odds of having no interest, 5.27 times higher odds of depression, 6.78 times higher odds of anxiety, and 3.99 times higher odds of worrying in 2020 than in 2019. In 2021, non-Hispanic Blacks experienced 3.76, 5.36, 6.74, and 3.80 times higher odds of having no interest, depression, anxiety, and worrying, respectively, compared with the pre-pandemic period. PDI for non-Hispanic Blacks increased by 16.26 points in 2020 and 14.21 in 2021, relative to the pre-pandemic period. Hispanics experienced 4.09 times higher odds of having no interest, 4.91 times higher odds of depression, 6.03 times higher odds of anxiety, and 3.93 times higher odds of worrying in 2020 than in 2019. In 2021, Hispanics experienced 4.18, 4.99, 5.53, and 3.80 times higher odds of having no interest, depression, anxiety, and worrying, respectively, compared with the pre-pandemic period. PDI for Hispanics increased by 17.81 points in 2020 and 15.70 points in 2021, relative to the pre-pandemic period.
Non-Hispanic Asians experienced 7.02 times higher odds of having no interest, 10.17 times higher odds of depression, 14.99 times higher odds of anxiety, and 10.68 times higher odds of worrying in 2020 than in 2019. In 2021, non-Hispanic Asians experienced 6.94, 9.87, 12.27, and 8.78 times higher odds of having no interest, depression, anxiety, and worrying, respectively, than in 2019. PDI for nonHispanic Asians increased by 16.70 points in 2020 and 13.89 points in 2021, relative to the pre-pandemic period. Non-Hispanic other races experienced 3.39 times higher odds of having no interest, 4.16 times higher odds of depression, 5.97 times higher odds of anxiety, and 3.26 times higher odds of worrying in 2020 than in 2019. In 2021, nonHispanic other races experienced 3.78, 4.60, 5.54, and 3.29 times higher odds of having no interest, depression, anxiety, and worrying, respectively, than in 2019. PDI for non-Hispanic other races increased by 17.98 points in 2020 and 16.90 points in 2021, relative to the pre-pandemic period.
Figure 1 shows marginal effects, which are the absolute difference in the adjusted average predicted probabilities (prevalence) between before and during the pandemic. The increase in the adjusted predicted prevalence of having no interest was higher for nonHispanic others, non-Hispanic Blacks, and Hispanics than non-Hispanic Whites in both 2020 and 2021 (Figure 1). The increase in the adjusted predicted prevalence of having depression was higher for nonHispanic others, non-Hispanic Blacks, Hispanics, and non-Hispanic Asians in 2020, than non-Hispanic Whites. The increase in the adjusted predicted prevalence of having anxiety was higher for non-Hispanic others and Hispanics than non-Hispanic Whites. The increase in the adjusted predicted prevalence of worrying was higher for all racial/ethnic minorities during the pandemic, compared with non-Hispanic Whites.
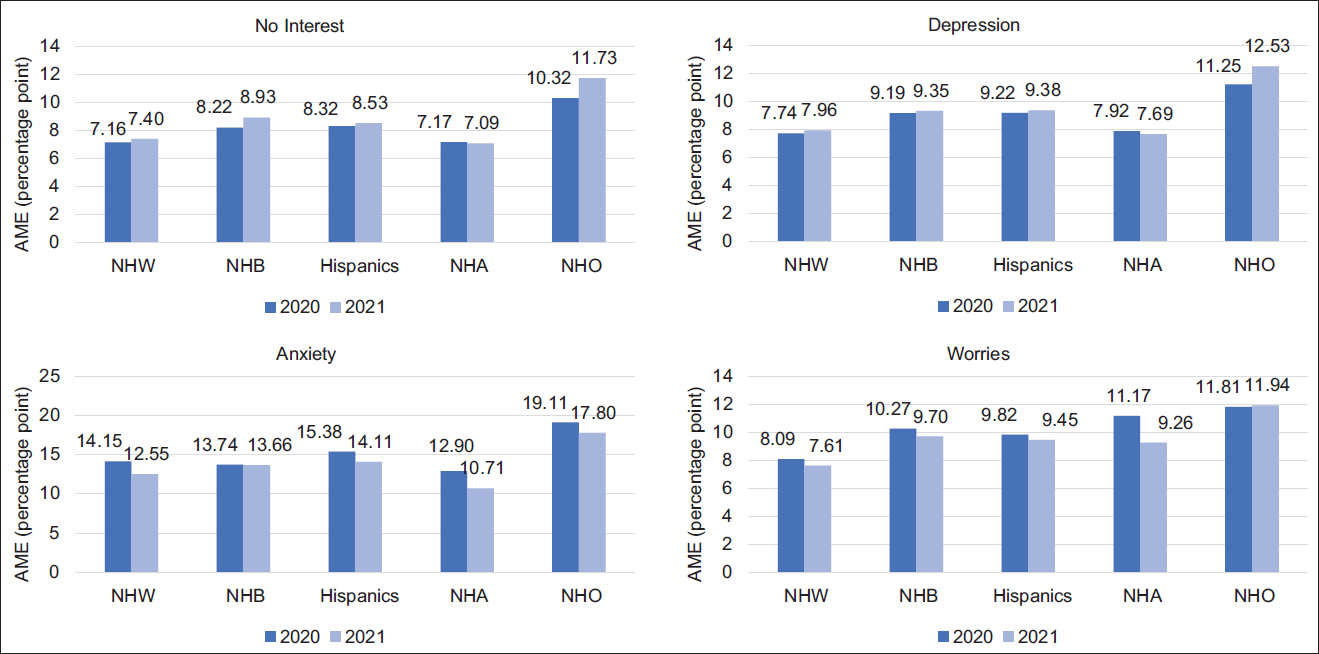
- Changes in Adjusted Average Marginal Effects of the COVID-19 Pandemic on No Interest, Depression, Anxiety, and Worries During the Pandemic by Race/Ethnicity, US Adults Aged 18 years or Older AME=Average Marginal Effect; NHW= Non-Hispanic Whites; NHB=Non-Hispanic Blacks; NHA=Non-Hispanic Asians; NHO=Non-Hispanic other races. Marginal effects were estimated using logistic regression adjusted for age, sex, education, household income, marital status, employment status, insurance status, housing tenure, and region of residence.
Discussion
Our study has shown findings generally consistent with previous studies that racial and ethnic minorities in the US have experienced disproportionately higher risks of psychological distress, including depression and anxiety, during the pandemic in 2020.15,25,26 Our study found that non-Hispanic Blacks, Hispanics, non-Hispanic Asians were more likely to experience having no interest or depression in 2020 and 2021, compared with non-Hispanic Whites, except for having no interest in 2020 for non-Hispanic Blacks. The lower increase in the rate of depression and anxiety for non-Hispanic Blacks compared with non-Hispanic Whites in the previous study might arise from the difference in the study period. In fact, Twenge et al. found that non-Hispanic Blacks showed a higher increase in the rate of depression than nonHispanic Whites in Fall 2020, while Blacks had a lower increase in the rate of depression than Whites in Summer 2020.25 This might be because of the potential lagged effect after the Black Lives Matter (BLM) movement had spread during the summer across the US.
We found that increases in the odds of psychological distress, including depression and anxiety, were disproportionately higher in racial/ethnic minorities during the pandemic, compared with non-Hispanic Whites, controlling for sociodemographic characteristics. This is an interesting and somewhat unexpected finding since previous studies found that non-Hispanic Asians were less likely to be influenced by financial hardships and non-Hispanic Blacks showed high levels of resilience during the pandemic.5,8 This particular finding of our study might be partly explained by racism or xenophobia.36-39 Since the BLM movement in many cities after the death of George Floyd in May 2020, Black Americans experienced 1.96 and 2.30-point increases in depression and anxiety associated with vicarious racism from May to July 2020.40 Pre-existing xenophobia and anti-Asian sentiments might be activated with stigmatized terms or blame- rhetoric such as “Chinese virus” or “Kung flu,”38,41 as the Chinese Government reported a cluster of cases of pneumonia in Wuhan, the first case of COVID-19.42 Asian Americans had experienced COVID-19 related racial discrimination, which has been shown to be associated with their depressive symptoms, anxiety, and worrying.37,38,41
In our study, although non-Hispanic others showed the lowest increase in the odds of mental health symptoms, it should not be ignored that non-Hispanic others had the highest increase in the prevalence of all mental health symptoms (absolute difference) and had the highest level of mental health symptoms at baseline as well. Further studies should conduct subgroup analysis of the non-Hispanic other groups, which mostly consists of AIANs, Hawaiians and Pacific Islanders, and mixed races, to find reasons behind the highest prevalence of depression and anxiety. Given that AIANs have the highest rates of uninsurance, unemployment, poverty, and disability,43 and the highest COVID- 19-related hospitalization and mortality,3,4 there might have been an interaction effect between the pandemic and their socioeconomic and health conditions.
Considering our findings regarding the increase in the prevalence of depression and anxiety during the last two years and emerging new variants of coronavirus, the US might be faced with increased COVID-19-related mental healthcare needs. However, outpatient and inpatient visits or admission of mental healthcare services, group psychotherapy, or peer supporting meetings have been reduced for infection-control reasons or physical distancing requirements.44 Moreover, racial and ethnic minorities are more likely to report that the pandemic has changed their mental healthcare access compared with non-Hispanic White.45 To improve mental healthcare access during the pandemic, policymakers might consider home-based treatment or telehealth as an alternative to in-person care.44 As a response to increasing demand for telehealth services, for example, the US government relaxed the rule related to the reimbursement for remote patient monitoring services for Medicare and Medicaid beneficiaries.46 However, it should not be neglected that telehealth might have challenges related to internet access, privacy, data security, or overutilization, and might not be appropriate for certain populations such as older, under-educated, or low-income populations with difficulties in access to remote services, even exacerbating mental health disparities.44
Limitations
This study has limitations. First, 2019 NHIS and 2020-2021 HPS have different time scales for the four mental health outcome measures. NHIS measured PHQ-2 and GAD-2 over the last two weeks, whereas HPS measured those outcomes during the last one week prior to the survey. The prevalence of mental health outcomes in 2020 might be underestimated due to the shorter period of time scale compared to 2019.25 Second, there might be an omitted variable bias from other risk factors of mental health such as chronic health conditions, environmental characteristics, quarantine, social supports, or behavioral risk factors including sleep deprivation, binge-watching television, social media exposure, and alcohol use.44 Further studies need to consider assessing the effects of other risk factors on mental health, provided such data are available. Finally, the increase in depression and anxiety rates might be overestimated as an effect of COVID-19 because the change was not compared with a control group. Although there is hardly any place that was not affected by the pandemic, future studies might consider using difference-in-difference or an experimental method by defining appropriate control groups.
Conclusions and Implications for Translation
Using 2019 as a baseline, all racial/ethnic groups experienced a dramatic increase in rates of depression and anxiety in 2020. In 2021, the probability of experiencing depression and anxiety remained significantly high compared with 2019. All racial/ethnic minorities showed a higher increase in rates of depression and worries compared with non-Hispanic Whites. Non-Hispanic Blacks showed a higher increase in rates of all mental health outcomes compared with non-Hispanic Whites, except anxiety. Hispanics showed higher increases in all four measures compared with non-Hispanic Whites. Although non-Hispanic Asians had lower rates of all mental health symptoms than any other racial/ethnic group at the baseline in 2019, Asians showed the highest increases in the rates of depression and worries among all racial and ethnic groups. Non-Hispanic others showed the lowest relative changes but the highest prevalence for all four mental health symptoms before and during the pandemic.
Compliance with Ethical Standards
Conflicts of Interest:
The authors have no conflicts of interest to disclose.
Financial Disclosure:
None to report.
Ethics Approval:
No IRB approval was required for this study, which is based on the secondary analysis of a public-use federal database.
Disclaimer:
None.
Acknowledgments:
None.
Funding/Support:
None.
References
- 2022. CDC Museum COVID-19 Timeline. CDC; (accessed )
- 2022. COVID Data Tracker CDC. (accessed )
- 2022. COVID-NET Laboratory-confirmed COVID-19 hospitalizations CDC. (accessed )
- Variation in COVID-19 mortality in the US by race and ethnicity and educational attainment. JAMA Netw Open. 2021;4(11):e2135967.
- [CrossRef] [PubMed] [Google Scholar]
- Growing job-related income losses, increasing social inequalities, and physical and mental health impact during the COVID-19 pandemic, United States, April-December 2020. Int J Transl Med Res Public Health. 2021;5(2):76-89.
- [CrossRef] [Google Scholar]
- Monthly trends in access to care and mental health services by household income level during the COVID-19 pandemic, United States, April: December 2020. Health Equity. 2021;5(1):770-779.
- [CrossRef] [PubMed] [Google Scholar]
- Food insufficiency and mental health in the US during the COVID-19 pandemic. Am J Prev Med. 2021;60(4):453-461.
- [CrossRef] [PubMed] [Google Scholar]
- Monthly trends in self-reported health status and depression by race/ethnicity and socioeconomic status during the COVID-19 pandemic, United States, April 2020 - May 2021. Ann Epidemiol. 2021;63:52-62.
- [CrossRef] [Google Scholar]
- Increasing trends in physical and mental health problems among US workers in different job sectors during the COVID-19 pandemic. Int J Transl Med Res Public Health. 2021;5(2):90-102.
- [CrossRef] [Google Scholar]
- Social isolation in Covid-19: The impact of loneliness. Int J Soc Psychiatry. 2020;66(6):525-527.
- [CrossRef] [PubMed] [Google Scholar]
- Combating physical inactivity during the COVID-19 pandemic. Nat Rev Rheumatol. 2020;16(7):347-348.
- [CrossRef] [PubMed] [Google Scholar]
- Mental health, substance use, and suicidal ideation during the COVID-19 pandemic—United States, June 24-30, 2020. Morb Mortal Wkly Rep. 2020;69(32):1049-1057.
- [CrossRef] [PubMed] [Google Scholar]
- Household Food Security in the United States in 2020. Economic Research Report No. (ERR-298) 55 pp. Economic Research Service U.S. Dept. of Agriculture. 2021. (accessed )
- [Google Scholar]
- Racial and ethnic disparities in the prevalence of stress and worry, mental health conditions, and increased substance use among adults during the COVID-19 pandemic— United States, April and May 2020. Morb Mortal Wkly Rep. 2021;70(5):162-166.
- [CrossRef] [PubMed] [Google Scholar]
- Psychological distress and loneliness reported by US adults in 2018 and April 2020. JAMA. 2020;324(1):93-94.
- [CrossRef] [PubMed] [Google Scholar]
- Suicidal ideation and thoughts of self-harm during the COVID-19 pandemic: The role of COVID-19-related stress, social isolation, and financial strain. Depress Anxiety. 2021;38(7):739-748.
- [CrossRef] [PubMed] [Google Scholar]
- Race and ethnic group disparities in emotional distress among older adults during the COVID-19 Pandemic. Gerontologist. 2021;61(2):262-272.
- [CrossRef] [PubMed] [Google Scholar]
- Fear of COVID-19 and the mental health consequences in America. Psychol Trauma. 2020;12(S1):S17-S21.
- [CrossRef] [PubMed] [Google Scholar]
- Trajectories of mental distress among u.s. adults during the COVID-19 pandemic. Ann Behav Med. 2021;55(2):93-102.
- [CrossRef] [PubMed] [Google Scholar]
- Correlates of mental health symptoms among US adults during COVID-19, March-April 2020. Public Health Rep. 2021;136(1):97-106.
- [CrossRef] [PubMed] [Google Scholar]
- Race and ethnicity, gender, and age on perceived threats and fear of COVID-19: Evidence from two national data sources. SSM - Popul Health. 2021;13:100717.
- [CrossRef] [PubMed] [Google Scholar]
- An examination of racial and ethnic disparities in mental health during the Covid-19 pandemic in the U.S. South. J Affect Disord. 2021;295:471-478.
- [CrossRef] [PubMed] [Google Scholar]
- Prevalence of depression symptoms in US adults before and during the COVID-19 pandemic. JAMA Netw Open. 2020;3(9):e2019686.
- [CrossRef] [PubMed] [Google Scholar]
- The Implications of COVID-19 for mental health and substance use. Kaiser Family Foundation; Published February 10, 2021 (accessed )
- Anxiety and depressive symptoms in U.S. Census Bureau assessments of adults: Trends from 2019 to fall 2020 across demographic groups. J Anxiety Disord. 2021;83:102455.
- [CrossRef] [PubMed] [Google Scholar]
- A longitudinal study of psychological distress in the United States before and during the COVID-19 pandemic. Prev Med (Baitim). 2021;143:106362.
- [CrossRef] [PubMed] [Google Scholar]
- Design and Operation of the 2020 Household Pulse Survey. US Census Bureau; 2020. Forthcoming (accessed )
- 2021. Household Pulse Survey: Measuring Social and Economic Impacts during the Coronavirus Pandemic. U.S. Census Bureau; (accessed )
- Survey Description, National Health Interview Survey 2019. 2020. Center for Disease Control and Prevention. (accessed )
- [Google Scholar]
- Prevalence and socio-behavioral determinants of psychological distress among cancer patients and survivors in the United States, 2010-2015. Conference Proceedings of the American Association for Cancer Research.
- Impact of neighborhood social conditions and household socioeconomic status on behavioral problems among US children. Matern Child Health J. 2012;16(1):158-169.
- [CrossRef] [PubMed] [Google Scholar]
- Social determinants of mental health. Int Rev Psychiatry. 2014;26(4):392-407.
- [CrossRef] [Google Scholar]
- Social Determinants of Mental Health. Geneva, Switzerland: World Health Organization; 2014.
- Seemingly unrelated regression. In: Baltagi BH, ed. In: A Companion to Theoretical Econometrics. Malden, MA: Blackwell; 2001. p. :101-121.
- [CrossRef] [Google Scholar]
- Stata Statistical Software: Release 17 2021
- Ethics of research at the intersection of COVID-19 and black lives matter: a call to action. J Med Ethics. 2021;47(4):205-207.
- [CrossRef] [PubMed] [Google Scholar]
- Anti-Asian discrimination and the Asian-white mental health gap during COVID-19. Ethn Racial Stud. 2021;44(5):819-835.
- [CrossRef] [Google Scholar]
- COVID-19 Racial discrimination and depressive symptoms among Asians Americans: does Communication about the incident matter? J Immigr Minor Health. 2022;24(1):78-85.
- [CrossRef] [PubMed] [Google Scholar]
- Perceived discrimination and mental distress amid the COVID-19 Pandemic: evidence from the Understanding America Study. Am J Prev Med. 2020;59(4):481-492.
- [CrossRef] [PubMed] [Google Scholar]
- Vicarious racism and vigilance during the COVID-19 pandemic: mental health implications among Asian and Black Americans. Public Health Rep. 2021;136(4):508-517.
- [CrossRef] [PubMed] [Google Scholar]
- Xenophobia in the time of pandemic: othering, anti-Asian attitudes, and COVID-19. Polit Groups, Identities 2020:1-24.
- [CrossRef] [Google Scholar]
- Archived: WHO Timeline - COVID-19 WHO. Published April 27, 2020 (accessed )
- Trends in physical and mental health, mortality, life expectancy, and social inequalities among American Indians and Alaska Natives, 1990-2019. Int J Transl Med Res Public Health. 2021;5(2):227-253.
- [CrossRef] [Google Scholar]
- How mental health care should change as a consequence of the COVID-19 pandemic. Lancet Psychiatry. 2020;7(9):813-824.
- [CrossRef] [PubMed] [Google Scholar]
- Impact of the COVID-19 pandemic on mental health, access to care, and health disparities in the perinatal period. J Psychiatr Res. 2021;137:126-130.
- [CrossRef] [PubMed] [Google Scholar]
- Increasing access to care: telehealth during COVID-19. J Law Biosci. 2020;7(1):lsaa043.
- [CrossRef] [PubMed] [Google Scholar]