Translate this page into:
Quality and Safety Management of Health Care Service Delivery among Public Hospitals in Rwanda: a Cross-Sectional Survey
✉Corresponding author email: nd.deos09@gmail.com
Abstract
Background or Objectives:
Quality and safety of health care service delivery remain a challenge worldwide due to unsafe care, inappropriate practices, adverse events and medication errors that result in harm, disability and death of patients. This study examines the status of quality and safety management of health care service delivery in public hospitals in Rwanda.
Methods:
The study was a descriptive cross-sectional study. Overall population of interest comprised of 564 hospital managers from 47 hospitals. An online email-based questionnaire was used for data collection. Statistical analysis included bivariate, multivariable, and logistic regression analyses with significance at p<0.05. Data were analyzed using Statistical Package for Social Sciences (IBM Corp. Released 2012. IBM SPSS Statistics for Windows, Version 21.0. Armonk, NY: IBM Corp.).
Results:
The study sample population was 235 managers (5 persons from each hospital). Of the 235 responses received, 72.3% were from male managers and 27.7% were from female managers. The prevalence of adverse events among public hospitals in Rwanda is 0.007% (p=0.02, 95% CI: 0.017-0.023) with risk of incidents of 0.073%. In all, 98.7% of public hospitals reported incidents, and only 39.3% of them have regularly reported all types of incidents. The most common incidents were adverse drug event (25.3%), loss to follow-up/referrals (25%), and surgical site infection (20%). Rwanda has 0.043 (IQR: 0.032-0.060) doctors per 1,000 population. The country also has 0.25 (IQR: 0.18-0.33) nurses per 1,000 population. The 76.5% of respondents reported that variation of consultation time is between 10-15 minutes (p=0.003, 95% CI: 0.002-0.004) which is associated with 0.12% risk of incidents. The public hospitals have on average 44.25 ± 13.46 SD consultations per clinician per day. More than a half of respondents 54.3% (p=0.033, 95%CI: 0.029-0.036) reported that 10-20% of treatment given to patients were not needed and are significantly associated with high risk of incidents. The public hospitals score Level 1(documentation) (p=0.016, 95%CI: 0.014-0.019) for quality health care services delivery and, over half score Level 2(implementation). They also score Level 1(documentation) (p: 0.209, 95%CI: 0.201-0.216) for safe health care, and approximately half of them score Level 2(implementation).
Conclusion and Implications for Translation:
The quality and safety of health care services should be a priority for health care professionals and health care systems. The culture of blame and punishment is a challenge across hospitals. Reassuring adverse events reporting and learning from errors need to be emphasized and prioritized in public hospitals.
Keywords
Quality and Safety Management
Health Care Service Delivery
Rwanda
Quality and Safety Score levels

Introduction
Background of the study
Quality and safety of health care services delivery is an important global health concern. Patients experiencing adverse events result in 23 million Disability Adjusted Life Years (DALYs) lost annually. Lack of patient safety includes harm from inpatient adverse events such as medication errors, hospital- acquired infections, foreign body left in body during surgical procedure, etc.1,2 Research shows that the way hospitals are managed can influence the quality and safety of health care services.3 Hospital management comprises strategic plan, data- centered activities, quality improvement measures, implementation of policies and procedures related to quality and safety standards, tracking changes, and providing feedback. However, there is insufficient engagement of hospital management efforts to improve the quality of health care services delivery.4
Low quality and unsafe delivery of health care in hospitals are likely to be caused by diagnostic errors and inappropriate medical procedures. This, in turn, can lead to injury, permanent harm, and adjust the natural history of a disease.5 One study demonstrated that incorrect diagnoses were given at first to 87% of individuals with fibrodysplasia ossification progressiva (FOP).5 In the same vein, the safety of patients in U.S. hospitals is a critical issue, medical errors affecting a significant portion of admitted patients. Adverse events were found in 56% of the reviewed records of six Belgian Hospitals for unexpected referrals to the Intensive Care Unit or an inpatient medical emergency, of which practically half were considered highly preventable.6
Quality and safety of health care services is essential for health care effectiveness and efficiency as recognized by the World Health Organization's (WHO) agenda for health care reinforcement in Low and Middle Income Countries (LMICs).7 Even if current practices that refine quality health care are progressively used worldwide, their implementation is a challenge in developing countries.7
WHO patient safety resolution (WHA55.18) established the World Alliance for Patient safety by Secretariat in 2004; the program was renamed in 2009 as World Health Organization's Patient Safety Program.8 Since that time, the WHO has worked hard to address the challenges of quality and safety of health care services delivery. For example, in 2011, the WHO Director General renewed momentum for patient safety with a five-year strategy encompassing the following strategic objectives:
(1) to give worldwide authority for patient safety; (2) to harness knowledge, expertise and innovation to improve patient safety; and (3) to connect with health care systems, nongovernmental organizations, civil society and the expert community in the global endeavor of making medicinal services more safer.8
Rwanda, like many low- and middle-income countries (LMICs), pursues health care reforms in order to achieve universal health coverage (UHC). The advancement of national accreditation frameworks has become a quality system supported by payers, including Ministries of Health (MOH) and has made much progress in health care quality improvement.9 Three million Rwandans live in rural areas with accessibility to health facility within a distance of five (5) kilometers from their homes which results in increased access to health care services.10
The Rwanda Ministry of Health and all stakeholders have improved the health status of the population within five years since 2005. This was after the launch of the nation's Health Sector Strategic Plan which resulted in a blend of vigorous national ownership; an execution based condition with common responsibility at all dimensions; and a groundbreaking community based health insurance (CBHI) system across the country with an enrollment of 91% which increased the health care services's accessbility.11
Similalry, Rwanda has made a lot of progress in rebuilding its health sector in the last 22 years; and by 2015, it had met almost all the Millenium Development Goals health indicators.12 Health care system accreditation in Rwanda started with the University Teaching Hospitals, facilitated by Council of Health Care Service Accreditation of Southern Africa (COHSASA) in 2006, after which MOH started implementing the accreditation policy into district hospitals with their critical and core standards.13 The leadership and management support are crucial for improving quality and patient safety, given that strong leadership is important in making and continuing an organizational culture that underpins quality care delivery. Rwanda MOH called on all hospitals to improve quality of health care services delivery and consider the demand and supply of health care services to meet the the population needs.13 Accreditation is key to enhancing quality and safety of health care delivery system.14
Objectives of the study
The objective of this study was to examine the status of quality and safety management of health care service delivery among public hospitals in Rwanda. The specific aims were to: (1) establish the occurrence and factors that contribute to preventable adverse events in public hospitals; (2) determine quality and safety measures put in place for maintaining quality and safety of health care services delivery among public hospitals; (3) explore the needs and priorities for health care services improvement among public hospitals; and (4) explore the managerial aspects associated with patient-centered care and safety culture. Findings from this study will be useful for researchers, government, health care providers, and general public. The results will help health care providers to identify various ways to improve quality and safety of health care services delivered across Rwandan health care delivery systems.
Methods
The study was a descriptive cross-sectional study. The study was conducted in Rwanda, specifically in public health facilities from the districts up to the referral hospitals. Rwanda has 36 district hospitals, 4 provincial hospitals, and 7 referral hospitals. The study population comprised of 564 hospital managers from 47 hospitals. This included: one nursing director, one monitoring and evaluation officer, four clinical and primary health care supervisors, one accreditation officer, one human resource manager, one pharmacist, one clinical director/head of clinical services, one administrator, and one medical director per hospital. In anticipation of a low rate of response with online questionnaires, the study questionnaire was sent to 564 persons and limited to 235 responses (5 persons from each hospital). With the online questionnaires, the responses were emailed straight back to the researcher. Four Levels of Effort (LoE) scores for reaching the expectations were used. At Level 0, the desired activity is absent, or inconsistent activity related to risk reduction; at Level 1, the policies, procedures and plans are in place to address the risk; at Level 2, the processes are in place for consistent and effective risk- reduction activities; and at Level 3, there are data to confirm successful risk-reduction strategies and continued improvement.
Study variables
The researcher used Google form to design an email-based questionnaire with detailed variables of information to be collected into a Google spreadsheet as raw data. The questionnaire was divided into four categories: (1) Biography of respondents and their hospital settings, (2) Quality of health care service delivery, (3) Safety of health care services, and (4) Management of quality and safety of clinical services. The independent variables consist of biography of respondents, health facility descriptions, and quality and safety management; the intervening variables were accreditation and health care strategies; and the outcome variables were quality and safety of health care services delivery.
Statistical analysis
We conducted multivariable and logistic regression analyses. All analyses were performed using the Statistical Package for Social Sciences (SPSS), version 21 (IBM Corporation, 2017). For statistical tests, a p-value of <0.05 was considered to be statistically significant with 95% confidence interval [95% CI].
Ethical approval
The proposal was submitted for and received approval by the following: Institutional Review Board of Mount Kenya University, National Health Research Committee, Mount Kenya University, and Ministry of Health. The study followed the basic ethical principles, respected the research participants, and participation in the study was voluntary with informed consent. The study maintained confidentiality of private information and the study participants were informed of the study prior to data collection. Written informed consent was obtained from all study participants.
Results
Sociodemographic characteristics of study participants
Managers from all provinces in Rwanda participated in the study with a slight difference in number of respondents. The percent of participants in the study included 23.9% from Kigali City; 20.9% from Northern Province; 19.2% equally from Southern and Western Provinces; and 16.7% from Eastern Province.
Most of the respondents were males; of 235 responses received, 72.3% (170) were males and 27.7% (65) were females. Table 1 shows that of the 235 respondent-managers, 16 (6.8%) had advanced diplomas; 150 (64.1%) had bachelor's degree; and 68 (29.1%) had master's degree. The distribution of work experience among managers who responded were as follows: 60.7% of them had >5 years of experience; 39.5% of them with 2-5 years; and 3.4% of them had <2 years of work experience. A majority of the respondents representing 188 (80%) were from district hospitals, and, as would be expected, 76.6% were from public hospitals; 25 (11%) were from referral hospitals; and 22 (9%) were from provincial hospitals (Table 1).
| District Hospital | Provincial Hospital | Referral Hospital | Total | ||
|---|---|---|---|---|---|
| Sex | |||||
| Female | 50 | 5 | 10 | 65 | |
| Male | 138 | 17 | 15 | 170 | |
| Location of Hospital | |||||
| Eastern Province | 34 | 3 | 2 | 39 | |
| Kigali City | 44 | - | 12 | 56 | |
| Northern Province | 38 | 9 | 2 | 49 | |
| Southern Province | 38 | 4 | 4 | 46 | |
| Western Province | 34 | 6 | 5 | 45 | |
| Position | |||||
| Accreditation Officer | 14 | 3 | 3 | 20 | |
| Administrator/DAF | 16 | 4 | 4 | 24 | |
| Head of Clinical Services | 29 | 4 | 4 | 37 | |
| Human Resource Manager | 17 | 2 | 1 | 20 | |
| M&E/Supervisor | 36 | 3 | 1 | 40 | |
| Medical Director/DG | 28 | 1 | 5 | 34 | |
| Nursing Director | 28 | 2 | 1 | 31 | |
| Pharmacist | 20 | 3 | 6 | 29 | |
| Experience | |||||
| <2 years | 7 | 1 | - | 8 | |
| >5 years | 116 | 12 | 15 | 143 | |
| 2-5 years | 65 | 9 | 10 | 84 | |
| Level of Education | |||||
| Advanced Diploma | 15 | 1 | - | 16 | |
| Bachelors | 121 | 14 | 16 | 151 | |
| Masters | 52 | 7 | 9 | 68 | |
| Grand Total | 188 | 22 | 25 | 235 | |
Clinician-patient-ratio and prevalence of adverse events
The results show that Rwanda has on average 44.25 ± 13.46 (SD) consultations per clinician per day. Rwanda in general has 0.044 (IQR: 0.032-0.060) doctors per 1,000 population; Eastern Province had 0.049 and Kigali City had 0.046, both representing a slightly higher staffing ratio compared to the rest of the provinces. The country also has 0.25 (IQR: 0.18-0.33) nurses per 1,000 population (Table 2). Staffing regulations consist of limiting the number of patients assigned to each nurse and doctor.
| Variables | Mean | Variance | SD | Median | IQR | |
|---|---|---|---|---|---|---|
| Patient/Clinician/day | 44.25 | 181.30 | 13.46 | 45.00 | 35.00 | 50.00 |
| Health Utilization Rate | 0.239 | 0.015 | 0.123 | 0.207 | 0.146 | 0.340 |
| Total incidents | 25.19 | 175.20 | 13.24 | 15.00 | 5.000 | 28.00 |
| Prevalence of incidents | 0.007 | 0.000 | 0.006 | 0.005 | 0.003 | 0.010 |
| Risk of incidents | 0.073 | 0.015 | 0.121 | 0.052 | 0.010 | 0.040 |
| Doctors per 1000 population | 0.044 | 0.000 | 0.018 | 0.043 | 0.032 | 0.060 |
| Nurses per 1000 population | 0.252 | 0.009 | 0.093 | 0.228 | 0.182 | 0.330 |
On average, the prevalence of adverse events among public hospitals in Rwanda was 0.007 (p: 0.02, 95% CI: 0.017-0.023) and risk of incidents was 0.073.
The results showed that referral hospitals have higher risk of incidents at 0.084%, as compared to district hospitals that had 0.074% and provincial hospitals that had 0.033%. The southern province had high risk of incidents (0.14%) and a relatively low prevalence of incidents (0.005%) when compared to others provinces, and both are different from Kigali with high risk of 0.10% and high prevalence of 0.012% (Table 3).
| Variable | Value Label | Frequency n (%) | Prevalence of Incidents | Risk of Incidents | p-Value | (95%CI) |
|---|---|---|---|---|---|---|
| Type of Facility | District Hospital | 188 (79.9) | 0.006 | 0.074 | 0.02 | (0.017-0.023) |
| Provincial Hospital | 22 (9.4) | 0.005 | 0.033 | |||
| Referral Hospital | 25 (10.7) | 0.010 | 0.084 | |||
| Location of the Hospital | Eastern Province | 39 (16.7) | 0.008 | 0.028 | <0.001 | (0.000-0.001) |
| Kigali City | 56 (23.9) | 0.012 | 0.103 | |||
| Northern Province | 49 (20.9) | 0.004 | 0.019 | |||
| Southern Province | 46 (19.2) | 0.005 | 0.140 | |||
| Western Province | 45 (19.2) | 0.006 | 0.045 | |||
| Average of consultation time | 5 minutes | 39 (16.7) | - | - | 0.003 | (0.002-0.004) |
| 10 minutes | 102 (43.2) | 0.011 | 0.073 | |||
| 15 minutes | 78 (33.3) | 0.006 | 0.047 | |||
| 20 minutes | 10 (4.3) | 0.006 | 0.176 | |||
| >20 minutes | 6 (2.6) | 0.003 | 0.019 | |||
| Treatment that patients do not need | 1-10% | 68 (28.6) | 0.005 | 0.066 | 0.033 | (0.029-0.036) |
| 10-20% | 127 (54.3) | 0.012 | 0.084 | |||
| 20-30% | 39 (16.7) | - | - | |||
| 30-50% | 0 (0.0) | - | - | |||
| >50% | 1 (0.4) | 0.001 | - | |||
| Quality health care | Leve1.0 | 328 (17.5) | 0.015 | 0.117 | 0.016 | (0.014-0.019) |
| Leve1.1 | 883 (47.1) | 0.008 | 0.084 | |||
| Leve1.2 | 606 (32.4) | 0.003 | 0.033 | |||
| Leve1.3 | 56 (3.0) | 0.003 | 0.023 | |||
| Safe health care | Leve1.0 | 335 (17.9) | - | - | 0.209 | (0.201-0.216) |
| Leve1.1 | 938 (50.1) | 0.008 | 0.089 | |||
| Leve1.2 | 559 (29.9) | 0.007 | 0.061 | |||
| Leve1.3 | 41 (2.2) | 0.003 | 0.026 | |||
The majority of respondents (76.5%) reported that variation of consultation time is between 10-15 minutes which is associated with 0.12% of risk of incidents. More than a half of respondents, (54.3%) reported that 10-20% of treatments given to patients were not needed and are significantly associated with high risk of incidents (Table 3).
A high number of preventable incidents were found in Kigali City, Southern Province, and Western Province compared to the rest of the provinces.
The results show that most pressing incidents were adverse drug event (25.3%), lost to follow-up/referrals (25%), and surgical site infection (20%). The above incidents representing 70% could have been prevented. The 39.3% of the public hospitals reported all types of incidents; in addition, 10.3% exclude deep vein thrombosis (DVT) and 6% exclude DVT and injury due to medication (Figure 1).
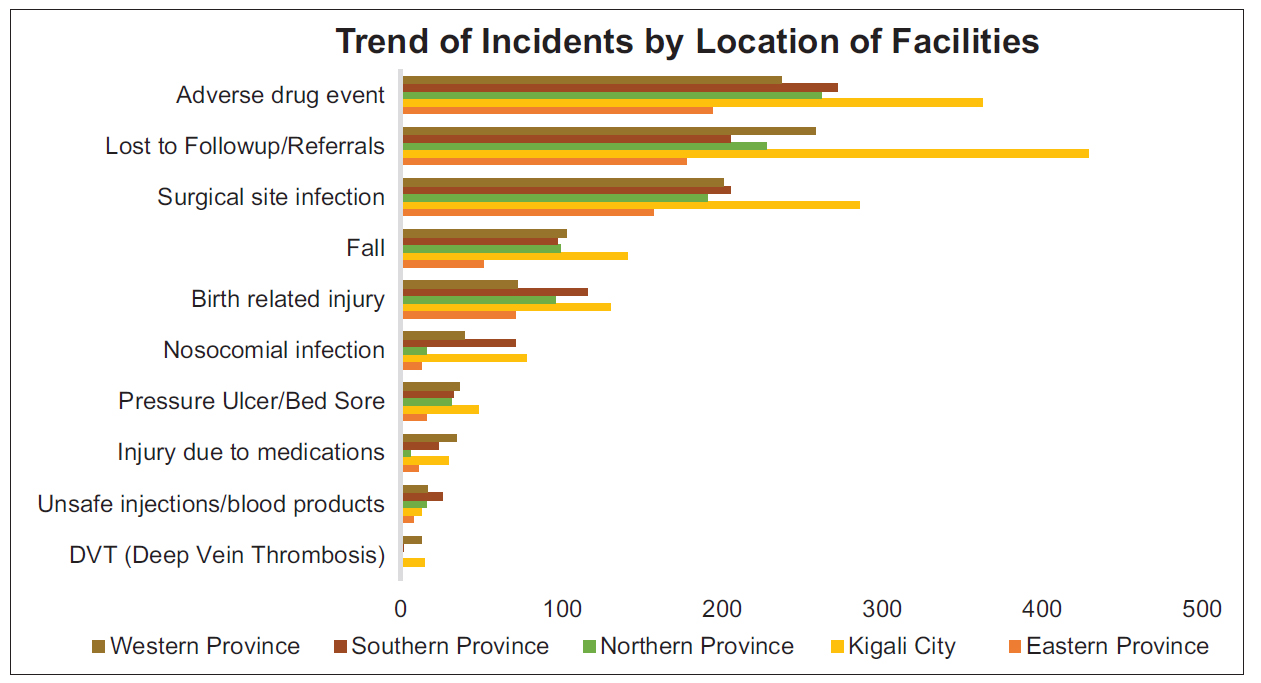
- Distribution of incidents by location of hospitals
Quality of health care services delivery
The Pearson correlation coefficient of 0.091 indicates a strong positive correlation between number of consultations per clinician per day and risk of incidents, sim and 0.067 indicates a strong positive correlation between health utilization rate and risk of incidents.
Using the four Levels of Effort (LoE) scores for reaching their patient delivery expectations, we found that the average score of public hospitals in terms of quality of health care services delivery in Rwanda was Level 1: documentation (p=0.016, 95% CI: 0.014-0.019). Over half of public hospitals scored on level 2: implementation, under 10% scored level 0: no documentation, and under 5% scored level 3: outcome. The completion of post-operative notes within 48 hours scored high at 62% for level 2; 30.8% for level 1; 3.8% level 3; and 3.4% level 0, the infection control measures flow (Figure 2).
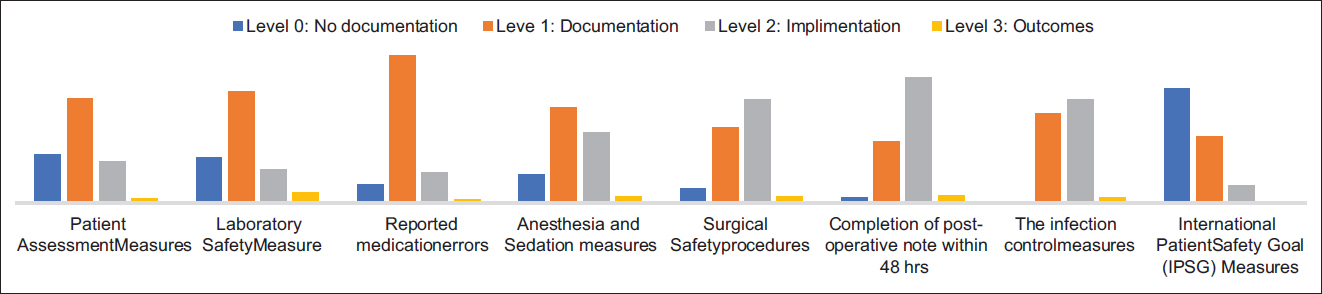
- Quality measures covered in hospital accreditation
The average LoE score of public hospitals in terms of safety of health care services delivery in Rwanda was level 1 (p=0.209, 95%CI: 0.201-0.216). Approximately half of the public hospitals scored on level 2; one third scored level 0; and under 5% of public hospitals scored level 3. Handwashing practices scored high 57.3% on level 2 and 4.7% on level 3 (Figure 3). There were statistically significant relationships between nurse per 1,000 population ratio, patients per clinician per day ratio, and health utilization rate with risk of incidents. However, there was no significant relationship between doctor per 1,000 population ratio and risk of incidents.

- Safety measures covered in hospital accreditation
Safety of health care services delivery
The results show that 98.7% of public hospitals reported incidents. However, 1.3% of the hospitals did not report incidents due to lack of incident reporting policy. Thus, they did not provide feedback of outcome from incidents. In all, 43.2% of respondents confirmed that equitable, safety, effectiveness, efficiency, timeliness, patient-centered care, and correct diagnosis were the key domains of safety and quality covered during accreditation process.
The results show that 46.6% of respondents confirmed that doctors were not putting in enough efforts, and that doctors did not have enough time to make the correct decisions. About 28.6% of them reported that doctors not having enough time to make the correct decisions was the reason why the patients were incorrectly diagnosed and treated. Finally, 15.4% of the respondents said that doctors were not putting in enough efforts, lacked medical knowledge, and did not have enough time to make the correct decisions.
Management of quality and safety of health care services delivery
Out of the 235 manager-respondents, 53.8% (126) confirmed that all investment priorities are needed to improve quality health care; 31.6% (74) excluded improved financial protection when accessing health care; and 8.5% highlighted the needs of equipment and clinical research as priorities of health care system investment. The results indicated the differences in top priorities among the managers were as follow: 37.6% (88) prioritized improved health outcomes; 35.5% (83) prioritized improved physical access to health care; and 23.5% (55) prioritized improved financial protection when accessing health care. The managers identified their top priorities to improve quality health care: 27.2% would invest in financial support; 25.9% on education for health care professionals; 18.8% on policy analysis; 17.9% on indicators; and 10.1% on international comparative statistics. Also, 29.9% of respondents mentioned policy analysis, financial support, and education for health care professionals as priority needs to improve quality health care. In addition, 30.7% of them identified indicators and international comparative statistics as their priorities.
Responses on strategies needed to improve patient-centred care varied among the respondents. In all, 21.4% identified increased funding; 20.7% identified building good will; 19.9% identified training of more health care professionals; 13% identified new ideas; 12.7% on execution skills; and 12.3% on technological innovations. The findings indicate that of the 235 respondents, 23.5% confirmed that new ideas, building will, increased funding, and training of more health care professionals were strategies needed to improve patient-centred care. The study findings indicate that 28.6% of respondents confirmed that electronic ordering, medication safety, patient-centred care, and clinical decision support were among the needs for electronic health records, and 25.2% identified efficiency of care.
On what factor most positively impacts patient experience, 21.8% of respondent-managers identified quality of care and patient satisfaction; 21.7% identified safety/no harm; 20.9% identified respect; 18.4% identified communication; and 17.2% identified empathy. The results show that 47.4% of respondents indicated that respect, safety/no harm, empathy, quality of care and patient satisfaction, and communication positively impacted patient experience, while 13.7% of them excluded empathy and 12.8% excluded communication as impactors of patient experience. On factors that negatively impact patient experience, 22.9% of respondents identified poor communication, 22.6% identified negligence, 21.7% identified disrespect, 19.5% identified rudeness, and 13.3% reported cost. About half of the respondents (49.1%) said that disrespect, cost, negligence, rudeness, and poor communication negatively impacted patient experience. Among the managers, 38% said the first steps to improve patient experience were improving communication, engagement, attentiveness of clinicians, and adoption of electronic health records in their respective hospitals.
The study indicates that 61.9% of respondents confirmed that personal level, micro-system/unit level, organization level change were needed to improve safety culture and patient experience in their respective hospitals, while 20.1% of them reported external level change. About 47.4% of participants used many types of assessment of awareness regarding the importance of their hospitals including 23% who said they used patient interviews, clinician interviews, and surveys. About 33% of public hospitals use randomized control trials, observational studies, and descriptive studies to examine health care service delivery.
Discussion
The findings indicate progress in quality and safety of health care service delivery. According to patient safety advocates, there is an increased recognition of patient safety improvement as a scientific and methodological process. In adopting a systems approach to patient safety, it is important to first examine facilitators in a system. The study reported
0. 073% preventable risk of incidence in Rwanda. Similar analysis in developed countries reported 9% of inpatient complications due to adverse events, of which around 44% may be preventable. Estimates from developed countries suggest that the adverse drug events varies between 7.5% and 10.4% of patients in acute care settings.15 One study in the U.S. estimated 251,000 deaths annually caused by medical errors.16 Medical errors in the U.S. result in annual unnecessary deaths of 44,000 to 98,000 and excess injuries of 1 million.17
Rwanda has on average 44.25 ± 13.46 (SD) consultations per clinician per day which is under the maximum standard of 50 consultations/clinician/ day. The study also indicate that 54.5% patients get treatment they did not need, which is associated with 0.081% risk of incidents. This study also found that 46.6 % patients are incorrectly diagnosed because doctors were not putting in enough effort, did not have enough time to make the correct decisions. Doctors may order extra, unnecessary, and potentially harmful tests to cover themselves from liability issues which also increases 2% of health care expenditures.18 Estimated 50% of drugs in developing countries are not what they are supposed to be.19 According to one study, patients are correctly diagnosed and cared for only about 55% of the time.20
For consultation time, 76.5% of patients spent 10-15 minutes with clinicians during consultation which is above the minimum consultation time of 5 minutes; however, this study found this to be associated with high risk of incidents (0.12%), which indicate the low quality of time spent with doctors. According to World Alliance for Patient Safety, the time spent with patients, waiting time and physician- patient interaction is important for closing the gap between patient expectations, patient experience and patient outcome as it breaks down barriers between patients and doctors, increases transparency, and provides users a voice within the system.21
The quality measure in health care uses health records to examine overall health plans and health care providers' performance against recognized quality standards. For Rwanda, accreditation and certification are frequently seen as an indication of exceptional standards and a demonstration that the organization meets pre-established standards. Development of significant quality measures and their application are ongoing as we have a tendency to collect and measure additional knowledge on quality.22 There is a deficiency in global health care systems for measuring the effect of errors on patient outcomes.23
According to the Australian Commission on Safety and Quality in Health Care,24,25 quality care is the right care for the right person at the right time, first given in accordance with guidelines for clinical practice or other protocols of evidence-based care. Health care that recognizes and incorporates individual patients' distinct wishes and needs, with emphasis on patient values and preferences increases positive patient experiences. Surveillance of reducible metrics for quality of care such us consultation time, number of questions asked works for routine check-ups, and number of physical exams should be implemented to enhance quality measures.26
Health investment priorities need to be increased at rate of 53.8% and there is an information gap on what role the health system is playing and how well the health system is doing, but not only health care spending contrast with health care outcome. Rwanda is a low income country where the resources are limited, but the country is trying to build a strong health system to maximize the effective use of available resources. An Australian study indicated that the problem is not simply lack of resources but how allocation of resources and incentives for doctors and patients were aligned. The incremental costs of accreditation ranged from 0.2% to 1.7% of the total cost over the accreditation cycle on average.27
For safety culture, 61.9% of respondents think culture change is needed at the personal level, micro-system/unit level, and organization level to improve safety culture and patient experience. In the majority of the situations, harm in health care is really due to human error.28 In a systematic review and meta-analysis of 12 dimensions on a Hospital Survey on Patient Safety culture (HSOPS), six scored under 50% of positivity, with “no punitive response to errors” the lowest one. In the meta-regression, three aspects were proven to be affected by the proportion of physicians and five by the continent where survey was held.29 To make a secure health care system, management must give some thoughts to systems of care. Understanding the parts of a system is vital to constantly improving system. Human behavior, processes, and technologies must be considered in efforts to enhance health care safety in a health care system.30 The disposition of health care professionals to have interaction in creating systems safer for patients needs a culture that extremely values safety. Assessing the culture of safety is crucial to confirm a safety culture and examining unsafe prerequisites one of the considerations is failure to correct a problem.31
In order to foster safety culture, practitioners should feel secure to document and report errors rather than creating pressure, bringing punishment, blame and shame, which can lead to hiding or denying errors.32 The accountability to report errors and near-misses and accountability to be a part of the answer to resolve drawbacks.33
Rigorous electronic health records are needed to improve quality and safety of health care. Health care providers should ensure that EHR are accurate and executed at lowest level, then build up to organizational, regional, national, and global levels. A study in Canada showed that when there was a promise of Electronic Medical Records (EMR) to measure quality of care, the increasing the use of EMR can change the way in which statistics to rework the method that knowledge on quality were collected, assessed, and on health care and health outcomes extra-factual, opportune, functional, and affordable.34 The researcher revealed that e-prescription would reduce by 55% of all adverse drug events.6
The physicians should continue to be involved; they need to be part of the procedure in order to appreciate its significance and purposeful structure. Gathering and analyzing records for lapses in patient safety affords a crucial first step and underpinning for lowering the opportunity of damage and re-engineering structures for improvement.35 Whereas it has been noted that there are substantial variations within the rates of errors in numerous countries, the fundamental kind of errors that occur in most settings are comparatively similar.36
Limitations
The study participants were busy persons with limited time. The study excluded all private hospitals in Rwanda, and cannot be generalized to all hospitals in the country. Also, due to the many discrepancies in quality and accessibility of care worldwide, the study cannot be generalized globally. More studies are needed on quality and safety of health care services in Rwanda and Africa to enhance forecasting and better allocation of resources in health subsidies. Such studies should emphasis further on evidence-based research and practice. More studies are also required to establish the leverage of hospital managers on quality and safety of health care services delivery. Such studies should examine the impact of accreditation on improvement of quality health care. Further studies are essential to demonstrate the potency of quality measures framework approach underneath structures, processes and outcomes of health care.
Conclusion and Implications for Translation
According to Rwanda health care managers, the priority needs required to improve health care in Rwanda are financial support, education for health care professionals, policy analysis, indicators, and use of international comparative statistics. The strategies needed to improve patient-centered care include increase funding, building will, training of more health care professionals, new ideas, execution skills and technological innovation. EHRs are needed for electronic ordering, medication safety, patient-centered care, clinical decision support and efficiency of care. The steps needed to improve patient experience are improving communication, engagement, attentiveness of clinicians, and EHRs need to be applied to public hospitals. The safety culture and measuring safety and quality of health care services are needed with the accreditation process of policy, standard procedures implementation in public hospitals in Rwanda.
Compliance with Ethical Standards
Conflicts of interest:
There is no conflict of interest declared with authors.
Financial Disclosure:
None.
Ethics Approval:
The ethical clearence obtained from Mount Kenya University and data collection approval from Rwanda Ministry of Health.
Disclaimer:
None.
Acknowledgments:
Mount Kenya University Administration, all lecturers from School of Public Health for their knowledge and skills that have been core element for guidance in achieving this level, Dr. Bethany HEDT-GAUTHIER who provided the first author a special training in research for a year and inspiring the first author to use practical research skills.
Funding/Support:
There was no funding/support for this study.
References
- What is the global burden of unsafe medical care? J Clin Outcomes Manag. 2014;21(2)
- [Google Scholar]
- Putting quality on the global health agenda. N Engl J Med. 2014;371(1):3-5.
- [CrossRef] [Google Scholar]
- Health professional networks as a vector for improving healthcare quality and safety: a systematic review. BMJ Qual Saf. 2012;21(3):239-249.
- [CrossRef] [Google Scholar]
- The role of hospital managers in quality and patient safety: a systematic review. BMJ Open. 2014;4(9):e005055.
- [CrossRef] [Google Scholar]
- Iatrogenic harm caused by diagnostic errors in fibrodysplasia ossificans progressiva. pediatrics. 2005;116(5):e654-e661.
- [CrossRef] [Google Scholar]
- One fourth of unplanned transfers to a higher level of care are associated with a highly preventable adverse Event. Crit Care Med. 2015;43(5):1053-1061.
- [CrossRef] [Google Scholar]
- The role of quality improvement in strengthening health systems in developing countries. Int J Qual Health Care. 2010;22(4):237-243.
- [CrossRef] [Google Scholar]
- Fifty-Fifth World Health Assembly.WHA55.18. 2002. Quality of Care: Patient Safety. WHO; (accessed )
- [Google Scholar]
- Accreditation as a path to achieving universal quality health coverage. Global Health. 2014;10(68)
- [CrossRef] [Google Scholar]
- Rwanda Annual Health Statistics Booklet. 2014. Rwanda Annu Heal Stat. :16-20. (accessed )
- [Google Scholar]
- Health in Rwanda is Improving! Mid term Review of the Rwanda Second Health Sector Strategic Plan (HSSP11,July 2009-June 2012) 2011. International Health Partnership. (accessed )
- [Google Scholar]
- Ministry of Health 20 years of rebuilding Rwanda's health sector. New Times Netw 2014:347833.
- [Google Scholar]
- Rwanda Hospital Accreditation Standards 2014:56.
- The impact of accreditation of primary healthcare centers: successes, challenges and policy implications as perceived by healthcare providers and directors in Lebanon. BMC Health Serv Res. 2014;14(1):86.
- [CrossRef] [Google Scholar]
- Patient safety without borders: measuring the global burden of adverse events. BMJ Qual Saf. 2013;22(10):798-801.
- [CrossRef] [Google Scholar]
- Your health care may kill you: medical errors. Stud Health Technol Inform. 2017;234:13-17.
- [CrossRef] [Google Scholar]
- Measuring Health Care: Using Quality Data for Operational, Financial, and Clinical Improvements. Hoboken, NJ: John Wiley & Sons; 2006.
- [Google Scholar]
- Time-trends and predictors of oral disease modifying drug treatment for multiple sclerosis. Pharmacoepidemiol Drug Saf. 2016;25(supp 3):3-679.
- [CrossRef] [Google Scholar]
- Measuring Health Care Quality: An Overview of Quality Measures. New York: Families USA; 2014.
- Summary of the Evidence on Patient Safety: Implications for Research. World Alliance for Patient Safety: World Health Organization; 2008.
- Potential of integrated continuous surveys and quality management to support monitoring, evaluation, and the scale-up of health interventions in developing countries. Am J Trop Med Hyg. 2009;80(6):971-979.
- [Google Scholar]
- BMJ analysis calls medical errors third leading cause of death, shines new light on ongoing problem. Pharm Today. 2016;22(7):36-37.
- [CrossRef] [Google Scholar]
- Patient- Centered Care: Improving Quality and Safety by Focusing on Patient and Consumers. Australian Commission on Safety and Quality in Healthcare; 2010.
- Health services accreditation: what is the evidence that the benefits justify the costs? Int J Qual Health Care. 2013;25(5):606-620.
- [CrossRef] [Google Scholar]
- Benchmarking: a method for continuous quality improvement in health. Healthc Policy. 2012;7(4):e101-119.
- [CrossRef] [Google Scholar]
- Economic evaluation of Australian acute care accreditation (ACCREDIT-CBA (Acute)): study protocol for a mixed-method research project. BMJ Open. 2013;3:e002381.
- [CrossRef] [Google Scholar]
- Estimating deaths due to medical error: the ongoing controversy and why it matters. BMJ Qual Saf. 860:5632017;26(5):423-428.
- [CrossRef] [Google Scholar]
- Healthcare professional's perception of patient safety measured by the hospital survey on patient safety culture: a systematic review and meta-analysis. Sci World J. 2018;2018
- [CrossRef] [Google Scholar]
- Factors influencing healthcare service quality. IntJ Health Policy Manag. 2014;3(2):77-89.
- [CrossRef] [Google Scholar]
- Implementing culture change in health care: theory and practice. Int J Qual Health Care. 2003;15(2):111-8.
- [CrossRef] [Google Scholar]
- World Health Organization, World Bank, Gavi, the vaccine alliance, Global Fund. Monitoring and Evaluation of Health Systems Strengthening: An Operational Framework 2009
- [Google Scholar]
- Factors affecting patient satisfaction and healthcare quality. Int J Health Care Qual Assur. 2009;22(4):366-381.
- [CrossRef] [Google Scholar]
- Overview of medical errors and adverse events. Ann Intensive Care. 2012;2(1):2.
- [CrossRef] [Google Scholar]
- The effect of electronic health records on patient safety: a qualitative exploratory study. Inform Health Soc Care. 2019;44(1):79-91.
- [CrossRef] [Google Scholar]
- A framework for scaling up health interventions: lessons from large- scale improvement initiatives in Africa. Implement Sci. 2016;11(1):12.
- [CrossRef] [Google Scholar]