Translate this page into:
Identifying Risk Factors and Spatial Clustering of HIV Infection Among Female Sex Workers in India
Abstract
Background:
The human immunodeficiency virus (HIV) epidemic in India is generally considered to be more concentrated, with the focus on high-risk groups including female sex workers (FSWs). The Integrated Biological and Behavioral Surveillance (IBBS), the first nationwide surveillance conducted during 2014-2015, collected many key indicators, including indicators related to HIV/STI transmission. The purpose of this study was to develop an index score for each domain surveyed and to identify focus areas for interventions among FSWs.
Methods:
The study population consisted of 27,007 FSWs. Forty high-risk related covariates of HIV/STI transmission, demographic characteristics, sexual history, condom practices, knowledge of HIV/STI and biological variables were considered. The original data set was examined using the correlation matrix and was reduced to 15 highly-correlated factors using principal component analysis. The factors were further improved using varimax rotation and the percentage of variation was used as weights to obtain the initial score for each domain, which were then standardized for comparison. Bartlett's test of sphericity was examined before the factor extraction.
Results:
Six factors were extracted, which together explained about 73% of the total variation. The factors were: (1) more number of clients; (2) younger FSW and started selling sex at younger age; (3) experiencing condom breakage; (4) having occasional clients and poor HIV/AIDS knowledge; (5) illiteracy; and (6) a longer period of sex work. Six domains with an index score of above 80, from the states of Maharashtra, Rajasthan, Arunachal Pradesh, Uttar Pradesh, and Jharkhand need greater intervention.
Conclusion and Implications for Translation:
FSWs' current age, age at commencement of sex work, and the number of clients were the indicators most-associated with HIV infection. Therefore, program and policy interventions should focus on FSWs who are younger than <25 years, who started selling sex at <22 years, and who have >10 clients.
Keywords
Female Sex Worker
Kriged Map
Factor Analysis
Principle Component Analysis
HIV
Sexually Transmitted Infections

Introduction
The National AIDS Control Organization (NACO) estimates that around 2.1 million people in India are living with HIV, out of which 40.5% are females.1 The epidemic in India is concentrated among high-risk group (HRG) populations, including female sex workers (FSW), men who have sex with other men, transgender people, and injection drug users. The infection is generally transmitted from HRGs to low-risk groups such as the general population through bridge populations such as migrants and truckers. Hence, containing the disease at the HRG level is considered effective in preventing the disease spread to the general population by advocating behavioral changes among HRGs. The National Integrated Biological and Behavioural Surveillance (IBBS),2 was conducted in 2014-15, with a strategic focus of strengthening HIV surveillance among high- risk groups (HRG) and bridge population. It was the first nationwide community-based bio- behavioral surveillance, among HRG and bridge populations that collected information on many key parameters of programmatic importance. Apart from the basic socio-demographic profile, the dataset also included knowledge indicators related to HIV prevention, sexually transmitted infections (STI), condom usage, HIV/AIDS services, behavioral risk profile and practices, HIV testing, stigma, and discrimination as well as exposure to HIV/AIDS services and community mobilization. Since several HIV/STI transmission- related variables were collected during the IBBS surveillance, it would be beneficial to bring out the essence of all the highly correlated HIV risk-related variables. Hence, the aim of this study was to develop an index or a score for each domain surveyed, based on multiple and highly correlated risk-related variables of HIV/ STI concurrently and to identify focus areas for interventions among FSWs.
Methods
Study Type
The National IBBS was a community-based cross-sectional survey designed using probability- based sampling. Numerous behavioral and biological variables of HIV/STI in India were collected. Blood specimens were collected using the Dried Blood Spot (DBS) method.
Study Population
Female sex workers were defined as any female, aged 15 years or older, who engaged in consensual sex in exchange for cash/payment in kind in the last month. The study population consisted of 27,007 FSWs from 73 randomly selected domains comprising 108 districts across 28 Indian states including Union territories, where the sizable number of FSWs are available (Appendix 1).
Domain
A ‘Domain’ was defined as a continuous geographical unit for which the bio-behavioral estimates generated for a specific (FSW/MSM/IDU/TG) group. The domains surveyed in the study were selected based on the size of the FSWs available in a particular domain. Generally, a single district was the basic domain in National IBBS, called independent domains. However, if a single district did not have an adequate sample size, neighboring districts were grouped to form a ‘Domain’, called composite domains. A domain name was given to each domain, which was either the district name in the case of independent domains, or the name of the district with the highest number of HRG for composite domains. All the domains were prioritized for targeted interventions by NACO.
Sampling Strategy
The respondents were recruited through a two- stage cluster sampling procedure. A conventional cluster sampling approach was used for fixed locations like home-based venues and brothels, A time-location cluster (TLC) sampling approach was used for dynamic clusters such as street-based FSWs. Each hotspot was divided into four clusters based on availability as follows: (1) Peak Day- Peak Time (peak days of operations, maximum FSW found at a particular time); (2) Peak Days - Lean Time (peak days of operations, minimum FSW found at a particular time); (3) Lean Day- Peak Time (lean days of operations, maximum FSW found at a particular time); (4) Lean Day-Lean Time (lean days of operations, minimum FSW found at a particular time). The TLCs were selected by systematic random sampling (without replacement) by probability proportional to the estimated measure of size (PPS) of FSWs.
The target sample size for the FSW group was 400 per domain. The sample size was less than 400 members in the case of fewer populations in the domain or when the refusal rate was high. The methodology, data collection, ethical consent, weighting procedure, laboratory methods, etc. are discussed in detail elsewhere.2 The study period was for three months and varied for each site from October 2014 to November 2015.
Study Variables
Forty covariates of HIV/STI transmission for FSW based on demographic characteristics, sexual history, condom practices, knowledge, and awareness of HIV/STI and biological variables were explored.
Statistical Analysis
Principal component analysis (PCA) and factor analysis are data reduction techniques employed to reduce the dimension of the covariates; these methods are used to extract a relatively smaller subset of independent uncorrelated factors and to find the linear combination of standardized indicators.3-5 In our study, these techniques were used to identify the underlying structure of the variables studied and to estimate the factor scoresAll the estimates used in the analysis were weighted based on the inverse probability of selection. The original dataset of 40 high-risk related covariates was examined using the correlation matrix. The final data set used in the analysis was of size 73 (domains) × 15 variables (Appendix 1). The PCA identified a smaller dimension of six (eigen value greater than one) uncorrelated factors. The six factors were improved using varimax rotation and their scores were acquired. Using percent variation as weights on factor scores, the initial score for each domain was then obtained and standardized for comparisons. To check for model adequacy, Bartlett's test of sphericity was done before factor extraction and was found to be suitable with p<0.0001. All the analyses were done using the SPSS (version 26) software.6
A geospatial interpolation technique called Kriging was used for points that were not physically sampled in the study area. The method of least squares was used, which estimates the values with the information surveyed and the spatial arrangement of the data set.7 The standardized score (as a proportion) for each surveyed domain was expressed as β(xi, yi), where (xi, yi) are the geographic coordinates (latitude and longitude). β(xi, yi) were modeled using a semi- variogram and the kriged values were obtained using the ArcGIS software package.8
Results
The initial and standardized index scores of the domains are presented in Table 1. Twenty-six domain sites had an index score of above 50 (more than the average). Considering all the high-risk related variables in a multivariate set up, the domain of Jalna in Maharashtra state had the highest score followed by Kota and Ajmer in Rajasthan; West Siang in Arunachal Pradesh; Jhansi in Uttar Pradesh; Lathiar in Jharkhand; and Pune in Maharashtra. The distribution of the domains and levels of care required based on the standardized index score of the surveyed domains are presented in Figure 1. The domains in deep red indicate the need for greater care and interventions.
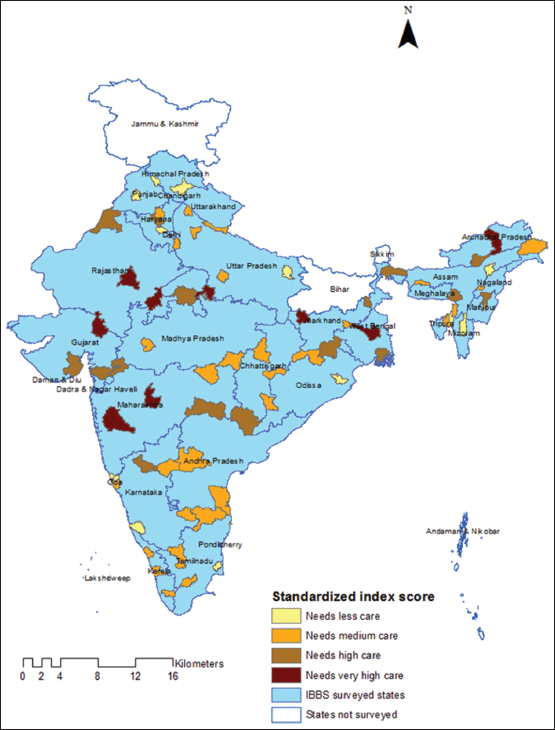
- Map showing standardized scores of HIV risk-related factors among female sex workers (FSW) in India: IBBS 2014-2015
| S.no# | State | Domain | Initial index | Standardized index | S.no# | State | Domain | Initial index | Standardized index |
|---|---|---|---|---|---|---|---|---|---|
| 1 | Maharashtra | Jalna | 76.21 | 100.00 | 37 | Arunachal Pradesh | Lohit | -5.42 | 40.84 |
| 2 | Rajasthan | Kota | 69.40 | 95.07 | 38 | Andhra Pradesh | Nellore | -6.73 | 39.89 |
| 3 | Rajasthan | Ajmer | 59.69 | 88.03 | 39 | Karnataka | Kolar | -7.1 1 | 39.61 |
| 4 | Arunachal Pradesh | West siang | 58.42 | 87.11 | 40 | Uttarakhand | Hardwar | -7.31 | 39.47 |
| 5 | Uttar Pradesh | Jhansi | 51.46 | 82.06 | 41 | Assam | Goalpara | -8.00 | 38.97 |
| 6 | Jharkhand | Latihar | 50.98 | 81.72 | 42 | Andhra Pradesh | Chittoor | -8.02 | 38.95 |
| 7 | Maharashtra | Pune | 49.28 | 80.48 | 43 | NCT Of Delhi | West | -8.37 | 38.69 |
| 8 | NCT Of Delhi | Central | 49.01 | 80.29 | 44 | Chhattisgarh | Mahasamund | -9.12 | 38.15 |
| 9 | West Bengal | Burdwan | 48.91 | 80.22 | 45 | Tripura | Dhalai | -11.06 | 36.74 |
| 10 | Gujarat | Sabarkantha | 47.89 | 79.47 | 46 | Assam | Karimganj | -11.56 | 36.38 |
| 11 | West Bengal | Jalpaiguri | 40.59 | 74.18 | 47 | Tamil Nadu | Madurai | -12.73 | 35.53 |
| 12 | Andhra Pradesh | Adilabad | 39.60 | 73.46 | 48 | Manipur | Imphal East | -13.23 | 35.17 |
| 13 | Manipur | Senapati | 33.30 | 68.90 | 49 | Haryana | Faridabad | -13.90 | 34.69 |
| 14 | West Bengal | 24 Paraganas (S) | 30.08 | 66.56 | 50 | Maharashtra | Nagpur | -14.25 | 34.44 |
| 15 | Meghalaya | Jaintia Hills | 27.29 | 64.54 | 51 | Goa | South Goa | -14.61 | 34.17 |
| 16 | Karnataka | Bagalkot | 24.23 | 62.33 | 52 | Kerala | Pathanamthitta | -17.01 | 32.43 |
| 17 | Gujarat | Surat | 22.92 | 61.38 | 53 | Puducherry | Pondicherry | -17.12 | 32.35 |
| 18 | Maharashtra | Nandurbar | 21.81 | 60.57 | 54 | Nagaland | Dimapur | -18.73 | 31.19 |
| 19 | Chhattisgarh | Dantewada | 15.12 | 55.72 | 55 | Jharkhand | Dhanbad | -20.79 | 29.69 |
| 20 | Jharkhand | Sahibganj | 13.52 | 54.56 | 56 | Karnataka | Raichur | -20.82 | 29.67 |
| 21 | Haryana | Jind | 12.76 | 54.01 | 57 | Haryana | Kaithal | -22.91 | 28.16 |
| 22 | Madhya Pradesh | Shivpuri | 12.07 | 53.51 | 58 | Chhattisgarh | Bilaspur | -24.62 | 26.92 |
| 23 | Arunachal Pradesh | Papum Pare | 1 1.54 | 53.13 | 59 | Uttarakhand | Udham Singh Nagar | -26.07 | 25.86 |
| 24 | Gujarat | Bhavnagar | 9.69 | 51.79 | 60 | Madhya Pradesh | Balaghat | -27.07 | 25.14 |
| 25 | Rajasthan | Ganganagar | 8.16 | 50.68 | 61 | Tamil Nadu | Thiruvarur | -28.47 | 24.12 |
| 26 | Jharkhand | PaschimSinghboom | 7.34 | 50.09 | 62 | Goa | North Goa | -28.75 | 23.92 |
| 27 | Andhra Pradesh | Mahabubnagar | 5.47 | 48.72 | 63 | Himachal Pradesh | Shimla | -29.63 | 23.28 |
| 28 | Madhya Pradesh | Indore | 4.22 | 47.82 | 64 | Mizoram | Aizwal | -30.67 | 22.53 |
| 29 | Tamil Nadu | Erode | 3.15 | 47.05 | 65 | Orissa | JaiPur | -35.23 | 19.22 |
| 30 | Tamil Nadu | Chennai | 1.24 | 45.66 | 66 | Haryana | Rohtak | -35.55 | 19.00 |
| 31 | Kerala | Kozhikode | -0.36 | 44.50 | 67 | Karnataka | Dakshina Kannada | -36.45 | 18.34 |
| 32 | Kerala | Thrissur | -0.42 | 44.46 | 68 | Assam | Jorhat | -41.55 | 14.64 |
| 33 | Orissa | Nabarangpur | -0.96 | 44.07 | 69 | Punjab | Punjab_All_ FSW | -44.81 | 12.29 |
| 34 | Uttar Pradesh | Kanpur Nagar | -3.19 | 42.45 | 70 | Tripura | North Tripura | -52.69 | 6.57 |
| 35 | Orissa | Sundargarh | -3.66 | 42.11 | 71 | Himachal Pradesh | Una | -60.00 | 1.27 |
| 36 | Uttar Pradesh | JyotibaPhule Nagar | -4.46 | 41.53 | 72 | Uttar Pradesh | Gorakhpur | -60.20 | 1.12 |
| 73 | Chandigarh | Chandigarh | -61.75 | 0.00 | |||||
#Serial number represents the serial number as well the rank obtained by the domains respectively
Bartlett's test of sphericity of high significance (p<0.0001) indicated that the selected variables were well-correlated, which is required for the factor analysis to be valid. The 15 variables with factor loadings greater than 0.6 are listed in Table 2. The six factors extracted together explained about 73% percent of the total variation. The six factors were: (1) having 10 or more regular clients in the past week, having 10 or more occasional clients in the past week, and having regular clients; (2) current age of the FSW ≤ 25 and had started selling sex at age <22 years; (3) experiencing condom breakage, and wanted to use condoms but could not use in the past month; (4) having occasional clients, never heard of any other sexually transmitted diseases, and having misconceptions about AIDS transmission; (5) HIV prevalence, illiteracy, and never used a condom; and (6) duration of sex work for more than 5 years. The first factor was set as the proxy for HIV infection.
| Variables | Component 1 | Component 2 | Component 3 | Component 4 | Component 5 | Component 6 | Communalities |
|---|---|---|---|---|---|---|---|
| HIV | 0.645 | 0.447 | |||||
| Any STI | 0.63 | ||||||
| Cannot read & write | 0.647 | 0.655 | |||||
| Current age<=25 years | 0.881 | 0.946 | |||||
| Duration of sex work >5 years | 0.89 | 0.888 | |||||
| Age at started selling sex <22 years. | 0.92 | 0.909 | |||||
| Never used a condom | 0.659 | 0.681 | |||||
| Experienced condom breakage last month | 0.881 | 0.813 | |||||
| Wanted to use but did not past month | 0.764 | 0.654 | |||||
| Have a regular client | -0.658 | 0.604 | |||||
| Have an occasional client | -0.641 | 0.764 | |||||
| 10 or more clients in the past week - Occasional Male Clients | 0.926 | 0.903 | |||||
| 10 or more clients in the past week – Regular Male Clients | 0.926 | 0.903 | |||||
| Never heard of any STI | 0.664 | 0.629 | |||||
| Incorrect belief about AIDS transmission- -global indicator | 0.643 | 0.561 | |||||
Component 1: Sex with More number of male clients (≥10) in a week (Regular or Occasional); Component 2: Younger FSWs (age ≤25 yrs.) and started sex at a younger age (<22yrs); Component 3: Condom usage (breakages and wanted but did not use); Component 4: Have occasional clients and improper knowledge of HIV/STI (not heard of STI & incorrect belief of about AIDS transmission); Component 5: Illiterate, HIV cases and never used a condom; Component 6: Duration of sex work for a longer period (≥ 5 yrs)
The map in Figure 2 depicts the best, unbiased representation of the essence of numerous HIV risk-related variables in the form of Kriged estimates. It represents the regional variations and the high-risk, HIV-concentrated regions (hot spots), and regions where FSW are at the greater risk of developing the HIV infection. The Kriged estimates identified the western part of central India that included Gujarat, and portions of Rajasthan, Madhya Pradesh, and Maharashtra as high-risk regions.

- Kriged estimates of the standardized scores of FSW in India: IBBS 2014-2015
Discussion
IBBS was an extensive cross-sectional survey conducted across India among the HRGs that has resulted in a huge data resource of great importance to policymakers. Just by looking at the HIV prevalence estimates the domains of higher prevalence will seem to be of programmatic importance for future interventions, which may not necessarily be the actual case. For instance, the state of Karnataka had been a high prevalent state for FSW, owing to the practice of traditional sex work. Although the districts of Bagalkot, Raichur, and Kolar had HIV prevalence greater than 5%, these domains fall behind the domain of Jalna with a prevalence of 2.62%. Thus, the data reduction techniques, PCA and factor analysis, used in this study have optimally reduced the dimensionality of variables in a multivariate set up to derive an index for each domain, such that emerging hotspots and contributing factors are well-identified. Rather than just considering the prevalence of HIV/STI estimates, this technique helps to probe further into the behavioral factors to identify the key domains that require greater interventional care.9
At the individual level, age, sexual debut, duration of commercial sex, type and number of clients, illiteracy, STD knowledge, presence of STI symptoms, condom breakage or non-usage, misconceptions about HIV transmission, were the risk related factors. These factors, being associated with higher infection risk, have been well-established through numerous behavioral studies. According to the National AIDS Control Programme III, FSWs having several clients per day and FSWs having 100 or more clients in a month are found to be at most risk.10 A study in the Indian district of Kolkata indicated that the odds of exposure of younger sex workers ≤ 20 years acquiring HIV were four times higher compared to the older age group.11 Similarly, surveillance data in Nepal reported that a larger proportion of HIV- affected victims were young female sex workers than older ones.12 Young FSW are more vulnerable to HIV than their older counterparts for reasons including a higher number of sexual partners, susceptibility to violence, and hence inability to negotiate condom use.13 A higher rate of damage to the cervico- vaginal epithelium because of the relatively immature genital tract anatomy of adolescent FSW has also been reported to increase their susceptibility to infection.11 Young age and duration of sex work are also associated with higher exposure risk, due to the probability of having higher number of sexual partners.
At the domain levels, the priority-domains reported having higher standardized index scores had a comparatively lower prevalence (< 3%) except Kota. On the other hand, the domains Mahabubnagar (Andhra Pradesh), Aizwal (Mizoram), Pune (Maharashtra), Kota (Rajasthan) and Imphal East (Manipur) had the highest HIV prevalence (> 10%) among FSW. This indicates that the identified priority-domains were either emerging hotspots or increasing high-risk related behaviors among FSW. Accordingly, the proportion of FSW having 10 or more clients and misconceptions about HIV transmission was invariably much higher in the priority-domains as well as in the domains of Gujarat state indicating higher exposure risk.
Kriged estimates revealed that Western India including Gujarat and parts of Rajasthan, Maharashtra, and Madhya Pradesh as high-risk regions. Correspondingly, an increase in the number of HIV/ AIDS related deaths has been reported in Gujarat.14
High HIV prevalence was reported among females in Madhya Pradesh, with a larger proportion of affected being aged between 21 and 40 years.15 The World Health Organization stated that Rajasthan was at higher risk of HIV transmission due to its geographical and occupational reasons such as tourism.16 Our study identified hot spots in Maharashtra and Rajasthan.10 HIV sentinel surveillance conducted in 2016-17 indicated an overall decline in HIV infection in India; however, Gujarat and Rajasthan reported a rising trend in HIV prevalence.17 Similar analyses done earlier, showed 63 districts with consistently high HIV prevalence clustered in the South and the North-east regions of India including some districts in Maharashtra.18 Given its geographic and cultural diversity, an overall analysis of the cross-sectional survey might have masked certain regional high-risk factors. For instance, injection drug use (IDU) is a major cause of HIV transmission in North-East India; IDU practices among FSW have been reported in Northeast India19,20 that need to be considered for interventions in these regions. Our study reveals that the clustering has now shifted to the central regions of India. Continuous interventions at the previously identified high-risk regions had been instrumental in bringing about behavioral change among the FSW. Hence, it would be appropriate to target FSW and domains with increased HIV risk- related factors and prioritize interventional care.
Limitations
Though this surveillance was conducted during 2014-2015, this was the only latest available behavioral data to study the FSWs and their behaviors in India. Nonetheless, it is considered as relevant in the present scenario as the behaviors of HRGs hardly change within short period of time. In addition, migration and double counting are some of the major problems for any survey. These information were not collected in IBBS and may pose another source of limitation for the survey.
Conclusion and Implications For Translation
All 26 domains with a standardized score of 50 and above require priority care. The FSW at exposure risk, having limited knowledge about STI/HIV transmission and condom usage needs interventions for behavioral change. HIV estimates identify regions of high prevalence that need continued interventions. PCA and factor analysis revealed the factors that optimally contribute to higher infection risks and Kriged estimates identified hotspots of high-risk concentrated areas that need increased interventional care to prevent emerging infections. Globally, carrying out such studies at HIV epidemic regions will help to identify the target populations and emerging hotspots, thereby facilitating faster preventive measures.
Compliance With Ethical Standards
Conflicts of interest:
The author(s) declared that no potential conflicts of interest concerning the research, authorship, and/or publication of this article.
Ethics Approval:
IBBS study was approved by NACOs Ethics Committee on 26-July-2013, Ref. No: T-11020/20/2008-NACO(R&D). Written informed consent was obtained from all the participants. Respondents were informed about their voluntary nature of participation and were given clear information regarding the risks and benefits of their participation. Consent process emphasized that the participation was voluntary and they can withdraw from the IBBS at any point of time during the survey, which will not affect any services they used to receive from the NGOs or clinics. Participants' time spent during the survey was compensated.
Disclaimer:
None
Acknowledgments:
The authors wish to thank the Project Directors of all the State AIDS Control Societies and Regional Institutes for their support in completing the surveillance activities on time. The authors also express their gratitude to the concerned Referral Laboratories, State Surveillance Team members, and sentinel site personnel. The authors also express their special gratitude to Dr. Sanjay Madhav Mehendale, former Additional Director General, Indian Council of Medical Research, New Delhi, for his technical inputs towards conducting the surveillance.
Funding/Support:
The first author received funding from the National AIDS Control Organization for conducting the IBBS, especially in seven southern states of India. Permission also received for authorship and publication of this article. The publication of this article was partially supported by the Global Health and Education Projects, Inc. (GHEP) through the Emerging Scholars Grant Program (ESGP). The information, contents, and conclusions are those of the authors' and should not be construed as the official position or policy of nor should any endorsements be inferred by ESGP or GHEP.
References
- India HIV Estimations 2015: Technical Report. (accessed )
- National Integrated Biological and Behavioural Surveillance (IBBS), India 2014-15. High Risk Groups. (accessed )
- [Google Scholar]
- Multivariate statistical methods - A primer (3rd). New York: Chapman & Hall; 1986. p. :76-89.
- Development of an index of need for health resources for Indian States using factor analysis. Int J Epidemiol. 1991;20:246-50.
- [CrossRef] [PubMed] [Google Scholar]
- Mapping co-variates of mortality up to age of five years for Indian states. Indian J Public Health. 2003;47(1):22-26.
- [Google Scholar]
- Chicago, Illinois, USA: SPSS Inc; 2006.
- Epidemiologic mapping using the “kriging” method: application to an influenza-like illness epidemic in France. Am J Epidemiol. 1992;135:1293-300.
- [CrossRef] [PubMed] [Google Scholar]
- Environmental Systems Research Institute (ESRI), ArcGIS Desktop: Release 10. Redlands, CA, USA: ESR. 2006
- [Google Scholar]
- Development of an index of need for health resources for Indian States using factor analysis. Int J Epidemiol. 1991;20(1):246-250.
- [CrossRef] [Google Scholar]
- Targeted interventions for High-Risk Groups (HRGs) Operational Guidelines. (accessed )
- Epidemiology of HIV Infection among Brothel based Sex Workers in Kolkata, India. J Health Popul Nutr. 2005;23(3):231-235.
- [Google Scholar]
- HIV and young people who sell sex: A technical brief 2015. (accessed )
- Gujarat fifth in HIV deaths in country. Hindustan Times (Lucknow). Cited March 20, 2019 (accessed )
- [Google Scholar]
- The Hindu. Cited September 14, 2006 (accessed )
- The Times of India (Jaipur). Cited September 2011 (accessed )
- HIV infection declines, but new hotspots emerge in eight states. Cited January 12, 2018 (accessed )
- [Google Scholar]
- Determinants of consistently high HIV prevalence in Indian Districts: A multi-level analysis. PLoS ONE. 2019;14(5):e0216321. doi.org/10.1371/journal.pone.0216321
- [CrossRef] [PubMed] [Google Scholar]
- Spatial distribution and characteristics of injecting drug users (IDU) in five Northeastern states of India. BMC Public Health. 2011;11(1):64.
- [CrossRef] [PubMed] [Google Scholar]
- The prevalence of HIV in female sex workers in Manipur, India. J Commum Dis. 1999;31(1):23-8.
- [Google Scholar]
Appendix
| State Name | Domain name | Total | HIV Prevalence (50 | Any STI* | Cannot read & write | Current age <=25 years | Duration of sex work >5 years | Age at started selling sex <22 years | Never used a condom | Experienced condom breakage in the last month | Wanted to use condoms but could not in the past month | Have regular clients | Have occasional clients | Had 10 or more occasional male clients in the past week | Had 10 or more regular male clients in the past week | Never heard of other STHs | Misconceptions about HIV/ AIDS transmission- global indicator |
|---|---|---|---|---|---|---|---|---|---|---|---|---|---|---|---|---|---|
| Andhra Pradesh | Adilabad | 347 | 4.24 | 53.9 | 20.0 | 23.7 | 64.4 | 45.0 | 3.6 | 15.5 | 17.9 | 47.7 | 64.7 | 49.3 | 51.4 | 26.6 | 66.9 |
| Chittoor | 391 | 6.64 | 39.7 | 40.4 | 22.6 | 55.7 | 32.7 | 14.2 | 10.0 | 8.5 | 72.0 | 74.0 | 4.4 | 1.5 | 7.2 | 33.8 | |
| Mahabubnagar | 384 | 15.85 | 34.6 | 50.1 | 9.5 | 63.6 | 29.0 | 16.2 | 12.2 | 23.3 | 91.1 | 82.0 | 13.4 | 10.0 | 9.3 | 84.5 | |
| Nellore | 371 | 0.32 | 39.8 | 35.8 | 20.0 | 68.2 | 48.9 | 9.4 | 17.9 | 22.8 | 81.8 | 79.6 | 11.1 | 12.8 | 9.0 | 42.3 | |
| Arunachal Pradesh | Lohit | 389 | 0.19 | 28.2 | 10.8 | 46.4 | 42.6 | 62.2 | 1.4 | 27.1 | 8.7 | 91.1 | 84.8 | 10.8 | 7.3 | 20.6 | 53.3 |
| Papum Pare | 386 | 0.00 | 63.4 | 12.2 | 40.9 | 61.3 | 44.2 | 4.9 | 11.2 | 29.2 | 84.5 | 67.7 | 14.6 | 19.9 | 22.4 | 90.8 | |
| West siang* | 398 | 0.00 | 20.2 | 13.2 | 29.9 | 35.0 | 20.7 | 2.5 | 19.8 | 23.8 | 52.7 | 78.4 | 86.8 | 69.1 | 34.9 | 71.3 | |
| Assam | Goal para | 403 | 0.00 | 36.8 | 24.1 | 47.2 | 37.3 | 57.8 | 5.9 | 14.0 | 6.7 | 96.2 | 70.9 | 1.4 | 1.4 | 5.0 | 63.8 |
| Jorhat* | 408 | 0.00 | 28.8 | 1 1.6 | 19.7 | 30.7 | 22.4 | 0.9 | 13.5 | 1.4 | 97.2 | 88.6 | 9.0 | 9.8 | 6.6 | 63.8 | |
| Karimganj* | 402 | 0.82 | 87.8 | 20.4 | 42.7 | 60.6 | 69.6 | 2.4 | 7.0 | 1.3 | 88.4 | 67.9 | 6.4 | 20.8 | 10.3 | 61.1 | |
| Chandigarh | Chandigarh | 396 | 0.00 | 57.7 | 12.4 | 14.2 | 45.1 | 28.0 | 0.5 | 8.9 | 21.7 | 99.7 | 62.3 | 0.7 | 0.0 | 1.2 | 42.3 |
| Chhattisgarh | Bilaspur | 386 | 0.91 | 35.8 | 23.8 | 36.4 | 55.3 | 57.1 | 7.6 | 10.1 | 29.5 | 96.0 | 91.5 | 2.5 | 0.3 | 3.5 | 34.3 |
| Dantewada | 394 | 0.50 | 55.7 | 46.8 | 37.8 | 34.8 | 44.9 | 9.4 | 0.1 | 9.0 | 50.7 | 71.5 | 3.9 | 1.5 | 38.7 | 54.4 | |
| Mahasamund | 360 | 1.00 | 33.6 | 38.8 | 26.0 | 54.4 | 55.3 | 7.9 | 11.0 | 11.3 | 91.0 | 74.8 | 0.4 | 0.0 | 12.0 | 59.7 | |
| Goa | North Goa | 372 | 1.20 | 57.3 | 36.0 | 22.2 | 53.8 | 30.3 | 1.2 | 7.4 | 6.9 | 70.6 | 79.8 | 13.2 | 5.3 | 17.8 | 35.4 |
| South Goa | 394 | 0.93 | 59.9 | 36.5 | 16.0 | 84.5 | 65.3 | 9.7 | 10.9 | 11.7 | 98.3 | 95.5 | 6.8 | 5.5 | 7.9 | 56.2 | |
| Gujarat | Bhavnagar | 398 | 0.00 | 73.5 | 13.9 | 7.0 | 68.9 | 23.4 | 4.2 | 27.0 | 27.9 | 89.1 | 88.8 | 58.4 | 47.7 | 9.5 | 66.9 |
| Sabarkantha | 422 | 2.61 | 66.6 | 6.0 | 6.0 | 66.7 | 7.0 | 22.1 | 5.4 | 8.1 | 18.1 | 51.7 | 38.1 | 43.4 | 22.8 | 74.5 | |
| Surat* | 396 | 1.50 | 85.8 | 5.6 | 14.8 | 74.2 | 32.7 | 10.4 | 4.2 | 4.4 | 79.0 | 72.0 | 28.2 | 32.2 | 32.9 | 70.9 | |
| Haryana | Faridabad* | 402 | 0.94 | 70.7 | 9.9 | 30.6 | 54.2 | 55.3 | 4.8 | 8.3 | 10.8 | 90.1 | 86.9 | 10.0 | 4.5 | 26.9 | 62.1 |
| Jind | 283 | 0.69 | 51.0 | 13.1 | 32.2 | 71.4 | 69.4 | l.l | 25.3 | 22.5 | 94.3 | 83.0 | 22.2 | 21.8 | 21.9 | 77.0 | |
| Kaithal | 290 | 0.00 | 36.6 | 1.8 | 33.0 | 58.3 | 65.8 | 7.1 | 13.2 | 22.3 | 81.3 | 88.5 | 9.4 | 4.5 | 4.8 | 49.7 | |
| Rohtak | 393 | 0.42 | 86.6 | 19.1 | 23.6 | 58.3 | 39.3 | 1.4 | 10.1 | 1 1.3 | 60.8 | 89.4 | 20.6 | 6.9 | 11.0 | 13.3 | |
| Himachal Pradesh | Shimla* | 406 | 0.00 | 54.2 | 9.9 | 15.5 | 61.7 | 48.6 | 2.3 | 8.6 | 9.5 | 96.0 | 67.6 | 15.1 | 8.3 | 5.4 | 69.3 |
| Una* | 397 | 0.14 | 8.2 | 1.5 | 7.1 | 52.8 | 18.1 | l.l | 5.9 | 3.4 | 82.0 | 95.0 | 1.2 | 2.1 | 10.8 | 36.5 | |
| Jharkhand | Dhanbad | 389 | 0.19 | 38.5 | 33.6 | 18.4 | 28.6 | 24.8 | 6.0 | 12.9 | 10.8 | 49.2 | 51.7 | 4.9 | 2.1 | 14.2 | 38.2 |
| Latihar* | 327 | 0.60 | 21.8 | 43.7 | 43.1 | 30.7 | 49.7 | 15.1 | 18.8 | 8.0 | 98.0 | 53.6 | 0.0 | 0.0 | 25.9 | 57.3 | |
| PaschimSingh boom* | 281 | 0.14 | 84.0 | 35.7 | 68.6 | 38.8 | 79.0 | 0.7 | 23.3 | 40.5 | 95.1 | 74.7 | 0.7 | 2.2 | 24.9 | 50.8 | |
| Sahibganj* | 373 | 0.41 | 65.6 | 57.4 | 38.5 | 56.0 | 49.9 | 5.5 | 32.4 | 35.6 | 85.9 | 68.1 | 4.4 | 2.6 | 14.8 | 63.1 | |
| Karnataka | Bagalkot | 380 | 9.15 | 50.4 | 70.9 | 19.8 | 95.0 | 79.6 | 21.1 | 16.2 | 13.0 | 79.4 | 98.4 | 11.9 | 4.5 | 4.3 | 34.4 |
| Dakshina Kannada | 356 | 0.00 | 50.5 | 13.7 | 11.7 | 42.8 | 11.5 | 15.2 | 6.1 | 4.5 | 63.7 | 51.4 | 18.5 | 4.3 | 6.4 | 34.3 | |
| Kolar | 405 | 5.07 | 51.2 | 44.2 | 15.5 | 72.7 | 48.5 | 1.4 | 19.5 | 20.9 | 64.2 | 63.9 | 5.8 | 1.9 | 23.7 | 46.5 | |
| Raichur | 393 | 5.07 | 73.5 | 61.8 | 16.5 | 60.6 | 26.1 | 8.6 | 9.6 | 5.1 | 90.7 | 97.3 | l.l | 2.8 | 10.9 | 26.6 | |
| Kerala | Kozhikode | 331 | 0.26 | 22.3 | 15.6 | 1.8 | 86.8 | 11.7 | 26.9 | 8.7 | 10.4 | 82.5 | 76.8 | 4.4 | 3.1 | 12.1 | 45.6 |
| Pathanamthitta | 401 | 0.00 | 48.9 | 8.6 | 1.2 | 86.9 | 11.9 | 7.8 | 6.5 | 9.9 | 70.8 | 70.4 | 29.0 | 16.6 | 12.6 | 52.3 | |
| Thrissur | 139 | 2.65 | 26.0 | 29.3 | 2.2 | 79.3 | 10.7 | 13.5 | 22.0 | 23.5 | 83.3 | 74.7 | 5.3 | 0.1 | 23.7 | 58.8 | |
| Madhya Pradesh | Balaghat | 396 | 0.70 | 60.0 | 31.7 | 19.8 | 54.4 | 28.7 | 3.3 | 17.5 | 22.9 | 97.0 | 74.5 | 3.3 | 2.1 | 10.5 | 65.1 |
| Indore* | 401 | 0.91 | 43.5 | 30.8 | 30.8 | 67.8 | 64.9 | 3.0 | 22.5 | 41.9 | 90.3 | 86.2 | 30.7 | 19.6 | 11.0 | 32.5 | |
| Shiv pu ri* | 389 | 1.03 | 50.9 | 78.0 | 20.0 | 78.7 | 55.1 | 2.9 | 20.3 | 21.6 | 97.4 | 92.5 | 2.4 | 6.7 | 18.8 | 60.0 | |
| Maharashtra | Jalna | 380 | 2.62 | 55.7 | 34.9 | 15.9 | 61.7 | 23.7 | 17.2 | 9.6 | 5.9 | 43.3 | 40.3 | 40.9 | 43.2 | 57.2 | 72.4 |
| Nagpur | 411 | 1.33 | 62.0 | 19.9 | 28.2 | 67.9 | 54.6 | 4.5 | 11.5 | 2.5 | 91.6 | 92.7 | 23.2 | 16.3 | 10.9 | 53.2 | |
| Nandurbar | 165 | 8.55 | 73.3 | 43.9 | 36.7 | 57.5 | 56.2 | 10.4 | 17.9 | 7.5 | 64.6 | 75.1 | 13.2 | 17.0 | 23.6 | 40.8 | |
| Pune | 393 | 12.45 | 57.6 | 48.1 | 13.6 | 87.9 | 58.2 | 9.4 | 17.0 | 25.4 | 85.6 | 82.3 | 29.8 | 8.4 | 47.1 | 75.4 | |
| Manipur | Imphal East | 285 | 11.39 | 68.8 | 38.3 | 30.7 | 23.4 | 24.0 | 3.7 | 26.9 | 31.5 | 89.6 | 74.2 | 15.9 | 8.0 | 14.9 | 44.7 |
| Senapati | 290 | 0.69 | 70.4 | 21.2 | 46.8 | 22.1 | 43.6 | 10.9 | 14.3 | 32.7 | 89.9 | 76.3 | 8.6 | 4.5 | 59.4 | 80.3 | |
| Meghalaya | Jaintia Hills* | 404 | 9.54 | 43.2 | 15.8 | 53.5 | 33.3 | 36.6 | 3.1 | 14.9 | 10.7 | 46.1 | 58.9 | 40.2 | 13.5 | 35.6 | 74.7 |
| Mizoram | Aizwal* | 354 | 13.31 | 30.3 | 0.0 | 46.5 | 21.7 | 47.8 | 12.9 | 7.5 | 9.8 | 73.9 | 76.9 | 3.3 | 0.4 | 2.1 | 26.2 |
| Nagaland | Dimapur* | 399 | 2.55 | 83.9 | 18.0 | 34.8 | 38.3 | 48.4 | 5.7 | 28.1 | 13.8 | 94.8 | 89.0 | 4.8 | 6.8 | 8.8 | 51.3 |
| NCT of Delhi | Central | 391 | 2.43 | 33.5 | 38.9 | 32.8 | 64.0 | 42.7 | 16.9 | 11.5 | 8.6 | 39.4 | 66.6 | 50.0 | 52.7 | 16.7 | 48.2 |
| West | 409 | 0.00 | 73.5 | 21.3 | 35.2 | 58.3 | 56.0 | 3.7 | 19.3 | 18.5 | 79.8 | 84.8 | 27.3 | 24.2 | 7.1 | 29.1 | |
| Orissa | Jajpur* | 407 | 0.54 | 92.3 | 39.5 | 42.1 | 16.6 | 35.9 | 5.2 | 22.2 | 32.4 | 99.6 | 99.5 | 1.0 | 1.8 | l.l | 30.5 |
| Nabarangpur* | 396 | 1.13 | 76.2 | 50.3 | 42.4 | 55.2 | 72.4 | 6.0 | 6.9 | 30.0 | 92.6 | 95.2 | 10.5 | 14.4 | 3.1 | 36.4 | |
| Sundargarh | 395 | 0.21 | 7.5 | 14.1 | 78.9 | 29.4 | 93.0 | 4.7 | 2.5 | 4.1 | 94.6 | 95.4 | 4.5 | 7.4 | 13.1 | 31.7 | |
| Puducherry | Pondicherry* | 389 | 0.84 | 23.5 | 11.0 | 7.8 | 48.0 | 10.5 | 18.4 | 30.9 | 23.2 | 71.0 | 88.1 | 3.0 | 1.2 | 15.4 | 29.5 |
| Punjab | Punjab* | 396 | 2.14 | 53.2 | 13.5 | 21.8 | 39.5 | 37.7 | 1.9 | 10.9 | 15.3 | 85.4 | 73.2 | 15.5 | 14.4 | 3.7 | 14.8 |
| Rajasthan | Ajmer* | 382 | 0.24 | 69.0 | 11.3 | 41.6 | 61.2 | 66.9 | 10.0 | 5.6 | 7.6 | 48.2 | 44.5 | 68.2 | 39.2 | 35.7 | 78.6 |
| Ganganagar | 366 | 0.36 | 71.8 | 37.0 | 29.2 | 55.6 | 51.2 | 6.1 | 2.3 | 2.5 | 96.1 | 38.9 | 27.7 | 11.8 | 36.9 | 35.9 | |
| Kota* | 391 | 11.63 | 61.3 | 20.1 | 52.0 n | 85.0 | 79.1 | 12.7 | 1 1.3 | 12.4 | 87.4 | 69.9 | 60.7 | 41.4 | 33.0 | 65.5 | |
| Chennai | 376 | 0.11 | 27.2 | 31.9 | 11.3 | 31.5 | 10.7 | 38.7 | 15.4 | 5.5 | 96.5 | 85.2 | 5.3 | 2.2 | 8.4 | 23.0 | |
| Tamil Nadu | Erode* | 360 | 1.96 | 19.3 | 19.3 | 10.9 | 62.3 | 22.6 | 27.6 | 28.3 | 5.7 | 96.9 | 91.2 | 12.9 | 8.2 | 3.2 | 43.4 |
| Madurai | 385 | 2.10 | 45.1 | 16.0 | 5.1 | 63.4 | 18.1 | 17.1 | 12.2 | 14.4 | 88.9 | 86.2 | 7.0 | 12.9 | 18.8 | 46.2 | |
| Thiruvarur* | 356 | 0.25 | 10.4 | 18.0 | 4.4 | 53.4 | 7.7 | 10.5 | 17.1 | 12.3 | 82.9 | 84.9 | 9.0 | 3.2 | 21.0 | 38.8 | |
| Dhalai | 280 | 4.30 | 25.0 | 23.4 | 20.4 | 32.0 | 13.2 | 12.3 | 8.5 | 6.5 | 97.5 | 41.6 | 5.3 | 3.2 | 7.3 | 60.7 | |
| Tripura | North Tripura | 397 | 1.19 | 63.9 | 13.9 | 26.1 | 36.6 | 27.3 | 0.6 | 9.6 | 5.1 | 95.8 | 54.9 | 4.4 | 1.2 | 3.2 | 46.5 |
| Gorakhpur* | 396 | 1.61 | 17.7 | 9.4 | 14.0 | 40.2 | 13.6 | 1.0 | 0.3 | 1.6 | 99.4 | 60.9 | 3.4 | 4.4 | 30.2 | 10.0 | |
| Uttar Pradesh | Jhansi* | 394 | 0.00 | 32.0 | 46.2 | 24.5 | 44.7 | 28.8 | 11.9 | 8.5 | 7.8 | 60.8 | 41.5 | 44.4 | 31.2 | 26.6 | 45.3 |
| JyotibaPhule Nagar* | 399 | 1.72 | 80.6 | 51.0 | 30.3 | 49.5 | 59.1 | 0.7 | 3.7 | 3.2 | 93.0 | 38.3 | 9.2 | 3.0 | 22.5 | 87.1 | |
| Kanpur Nagar | 397 | 0.00 | 26.8 | 17.4 | 24.2 | 60.5 | 42.4 | 4.5 | 20.0 | 8.7 | 86.1 | 68.3 | 26.3 | 18.0 | 19.1 | 36.4 | |
| Hardwar | 380 | 0.1 1 | 92.5 | 27.2 | 26.0 | 71.7 | 40.2 | 2.7 | 31.4 | 35.0 | 91.7 | 96.6 | 2.8 | 3.4 | 18.3 | 68.0 | |
| Uttarakhand | Udham Singh Nagar | 390 | 0.51 | 63.0 | 32.7 | 25.6 | 47.0 | 29.4 | 0.9 | 30.4 | 18.9 | 86.6 | 69.1 | 7.4 | 5.1 | 6.8 | 42.3 |
| 24 Paraganas (S) | 385 | 1.92 | 27.9 | 70.5 | 31.6 | 48.1 | 41.5 | 15.3 | 33.3 | 4.7 | 90.7 | 88.3 | 13.3 | 1 1.9 | 15.3 | 62.2 | |
| West Bengal | Burdwan | 382 | 0.74 | 52.5 | 61.3 | 37.1 | 56.7 | 64.0 | 13.3 | 40.4 | 3.3 | 86.0 | 88.6 | 22.8 | 12.9 | 12.2 | 88.8 |
| Jalpaiguri | 198 | 4.55 | 41.9 | 72.2 | 30.3 | 63.7 | 67.2 | 17.2 | 20.7 | 6.6 | 90.4 | 94.9 | 19.1 | 12.8 | 29.8 | 45.5 |
*composite domain; # Had at least one STI symptom during the past 12 months (Vaginal dlscharge/lower abdominal pain without diarrhea or menses/Genltal ulcer or sores); STI – SexualiyTransmltted Infections, STD – Sexually Transmitted Diseases