Translate this page into:
Food Insecurity among Lesbian, Gay, Bisexual, and Transgender Adults During the COVID-19 Pandemic in the United States, July-October 2021
Abstract
Background :
The lesbian, gay, bisexual, and transgender (LGBT) population makes up approximately 6% of the total United States (US) population. Levels and patterns of food insecurity in the LGBT population during the COVID-19 pandemic compared with the general population are unknown. This study examines prevalence and sociodemographic correlates of food insecurity among LGBT and straight/heterosexual adults in the US.
Methods :
Using the US Census Bureau's Household Pulse Survey from July to October 2021 (N=372,542), differentials in food insecurity according to LGBT status were analyzed by multivariate logistic regression.
Results:
The prevalence of food insecurity during the pandemic was 25.6% for transgender adults aged ≥18, significantly higher than that for lesbian/gay adults (11.6%), bisexual adults (13.5%), and straight/heterosexual adults (7.8%). Compared with the straight/heterosexual population, LGBT adults had lower education and income levels and higher unemployment and were more likely to be non-Hispanic White and single. Transgender adults were particularly disadvantaged with respect to socioeconomic status, job loss, and lack of health insurance. After controlling for socioeconomic and demographic covariates, lesbian/gay, bisexual, and transgender adults experienced, respectively, 36%, 35%, and 157% higher odds of food insecurity than straight/heterosexual adults. Black/African American, Hispanic, and mixed-race/ethnicity, lower education and income, lack of home ownership, divorce/separation, lack of health insurance, and recent job loss were significant predictors of food insecurity among LGBT adults. Inequalities in food insecurity by LGBT status were similar in large metropolitan areas.
Conclusions and Implication for Translation:
Significant disparities in food insecurity exist with LGBT adults, particularly transgender adults, at substantially increased risk of experiencing food insecurity, economic hardship, and social disadvantage during the pandemic and likely in greater need of social and public assistance. Health policies aimed at improving the social and material conditions may lead to improved food security and health outcomes among LGBT adults and the general US population.
Keywords
COVID-19
Pandemic
LGBT
Heterosexual
Straight
Food Insecurity
Disparities
Race/Ethnicity
Socioeconomic Status
Metropolitan
Household Pulse Survey

Introduction
Over the past 20 months, the coronavirus disease (COVID-19) pandemic has had a devastating impact on the global economy, causing massive job and income losses, widespread social and economic disruptions, labor force shortages, rising food prices, and declines in economic growth and overall well-being.1-4 As a consequence, the pandemic has dramatically increased the number of people facing food insecurity and hunger in 2020-2021 both globally and in the United States.3-5 According to a recent report from the US Department of Agriculture (USDA), food insecurity for the total US population, broadly defined as limited access to adequate food because of lack of money and other resources, declined from a peak of 16.6% in 2009 to 10.9% in 2019, but, it rose to 11.8% corresponding to 38.3 million people with food insecurity during the COVID-19 pandemic in 2020,5 representing an increase of 3.1 million food-insecure people in just one year. The situation appeared to be much dire when comparing the monthly estimates of food insecurity during 2020; in fact, the prevalence of food insecurity among US adults aged ≥18 years rose from 8.2% in the pre-pandemic period before March 2020 to 13.7% during the peak pandemic period of December 2020.6
Food insecurity is an important social determinant of health and has been associated with a number of adverse health outcomes, including poor mental health, obesity, and chronic disease.7-10 There are significant disparities in food insecurity according to gender, race/ethnicity, socioeconomic status (SES), disability status, and rural-urban residence or geographical area.5,7,9 Food insecurity has been shown to be disproportionately higher among the vulnerable populations such as low- income households, racial/ethnic minorities, singleparent households, or those living alone during the pandemic.5,11-13 For example, individuals with annual household income below the poverty level experienced almost eight times higher food insecurity (37.5%) than those with incomes at ≥185% of the poverty level (5.00%) in 2020.11 In 2020, 24.0% of non-Hispanic Blacks and 19.3% of Hispanics experienced food insecurity, compared with 7.6% of non-Hispanic Whites.11
While data on food insecurity for the US are frequently analyzed by age, gender, race/ethnicity, and SES,5,7,11 prevalence estimates by sexual orientation and gender identity such as those for lesbian, gay, bisexual, and transgender (LGBT) adults are less well known and had not been available at the national level until recently.14-16 The LGBT population is a sizable community, comprising 5.6% of the total US population.17 LGBT groups are more likely to experience housing and food insecurity, financial difficulties, unemployment, and discrimination.16,18 One study showed that both male and female sexual minorities had 1.7 times higher odds of food insecurity, compared to heterosexual men and women.16 LGBT adults were about twice as likely to report not having enough to eat sometimes or often, compared with non-LGBT adults during the pandemic.14
In addition to the limited information on prevalence, social determinants of food insecurity among LGBT adults and potential explanations for such disparities and their access to and use of food assistance programs are not well studied. For example, it is not known whether sociodemographic correlates of food insecurity among LGBT adults differ from those observed for the non-LGBT or the general population. A few studies that do exist have shown that LGBT adults experience higher levels of food insecurity and elevated risks of social stigmatization, discrimination, personal stress, low social and familial support, health- risk behaviors, health care access, emergency room visits, hospital admission, poor mental and overall health than the general population.7,19,20 To address these research gaps in the literature, we use the latest data from the Household Pulse Survey6 to examine variations in food insecurity in the US according to LGBT status and other socioeconomic, demographic, and health care factors and to identify specific groups of LGBT adults who may be at increased risk of food insecurity and who may therefore require appropriate social, nutritional, and health care services. Specifically, we: (1) examine the prevalence of and reasons for food insecurity among LGBT adults in the US and compare these estimates with those for the straight/heterosexual population using large, nationally representative samples of US adults, and (2) examine socioeconomic and demographic predictors of food insecurity among LGBT adults and the general US population.
Methods
Data
Data on food insecurity and selected socioeconomic and demographic characteristics for LGBT and straight/heterosexual populations were derived from the six consecutive rounds of the US Census Bureau's Household Pulse Survey (HPS) conducted from July 21 through October 11, 2021.6,21 The six independent HPS samples from Phase 3.2 included: Week 34, July 21-August 2; Week 35, August 4-16; Week 36, August 18-30; Week 37, September 1-13; Week 38, September 15-27; and Week 39, September 29-October 11.6,21 Information on sexual orientation and gender identity was not available in the previous rounds of HPS conducted before July 2021. The HPS is a national sample household survey in which data on socioeconomic, demographic, self-assessed health, mental health, food insecurity, and health care characteristics during the COVID-19 pandemic are collected in near real-time via email and the internet. All information collected in the survey is based on self-reports. The HPS uses a systematic sample design and is representative of the civilian non- institutionalized population of the United States.1,2,6,22
The HPS was developed as a rapid response survey in order to track the social and economic impacts of the COVID-19 pandemic on American households on a weekly or a bi-weekly basis in partnership with several federal statistical agencies: Bureau of Labor Statistics, National Center for Health Statistics, Centers for Disease Control and Prevention, Maternal and Child Health Bureau, US Department of Health and Human Services (HHS/ASPE), National Institute for Occupation Safety and Health, US Department of Agriculture's Economic Research Service, National Center for Education Statistics, Department of Housing and Urban Development, Social Security Administration, Bureau of Transportation Statistics, Energy Information Administration, and Consumer Financial Protection Bureau.1,2,6,22 Substantive and methodological details of the HPS are available elsewhere.1,2,6,22
Measurement of Food Insecurity and Related Indicators
We pooled 6 rounds of HPS data during July- October 2021 to ensure sufficient sample sizes for analyzing food insecurity patterns by LGBT status and other sociodemographic characteristics. Food insecurity was derived from the question "Getting enough food can also be a problem for some people. In the last 7 days, which of these statements best describes the food eaten in your household? 1) Enough of the kinds of food (Uwe) wanted to eat; 2) Enough, but not always the kinds of food (Uwe) wanted to eat; 3) Sometimes not enough to eat; 4) Often not enough to eat.” Adults with responses 3 or 4 (i.e., sometimes or often not enough to eat) were defined as those experiencing food insecurity. Adults with responses 1 or 2 (i.e., having enough to eat) were considered to be food secure. Additionally, we considered several indicators of or reasons for food insecurity (e.g., not being able to afford food, neighborhood safety concerns, lack of transportation, and health limitations), and participation in food assistance programs such as the Supplemental Nutrition Assistance Program (SNAP) and receipt of free groceries or meals.
Definition of Sexual Orientation and Gender Identity, Primary Covariates of Interest
Starting with Phase 3.2 of the HPS, respondents were asked questions about their sexual orientation and current gender identity, the primary covariates of interest in this study. Regarding their sexual orientation, respondents were asked: "Which of the following best represents how you think of yourself (1) gay or lesbian; (2) straight, that is not gay; (3) bisexual; (4) something else; (5) I don't know?” The current gender identity variable was based on the question: "Do you currently describe yourself as male, female, transgender, or none of these?” For this study and consistent with past research,23 we combined the variables of sexual orientation and gender identity to create a composite variable, LGBT status, which consisted of 5 mutually exclusive categories: 1=lesbian or gay, 2=bisexual, 3=transgender, 4=straight/heterosexual, 5=other. In order to present aggregate data for all LGBT adults, we also defined LGBT status as a three-category variable: 1=gay or lesbian, bisexual, and transgender, 2=straight/heterosexual, 3=other. Those with missing data on LGBT status and food insecurity were excluded from the analysis, resulting in an effective/final sample size of 339,317 for analysis.
Socioeconomic and Demographic Covariates
Based on previous research and the social determinants of health framework, we selected the following covariates: age, race/ethnicity, marital status, region of residence, educational attainment, household income, housing tenure, recent household job loss, and health insurance status.5,11-13,24 These covariates were measured as shown in Figures 1 and 2. Additionally, the prevalence of food insecurity was analyzed for the 15 largest Metropolitan Statistical Areas (MSAs) of the US that were available in the HPS (Figure 1). The other metropolitan areas were not identified in the HPS public-use file.21
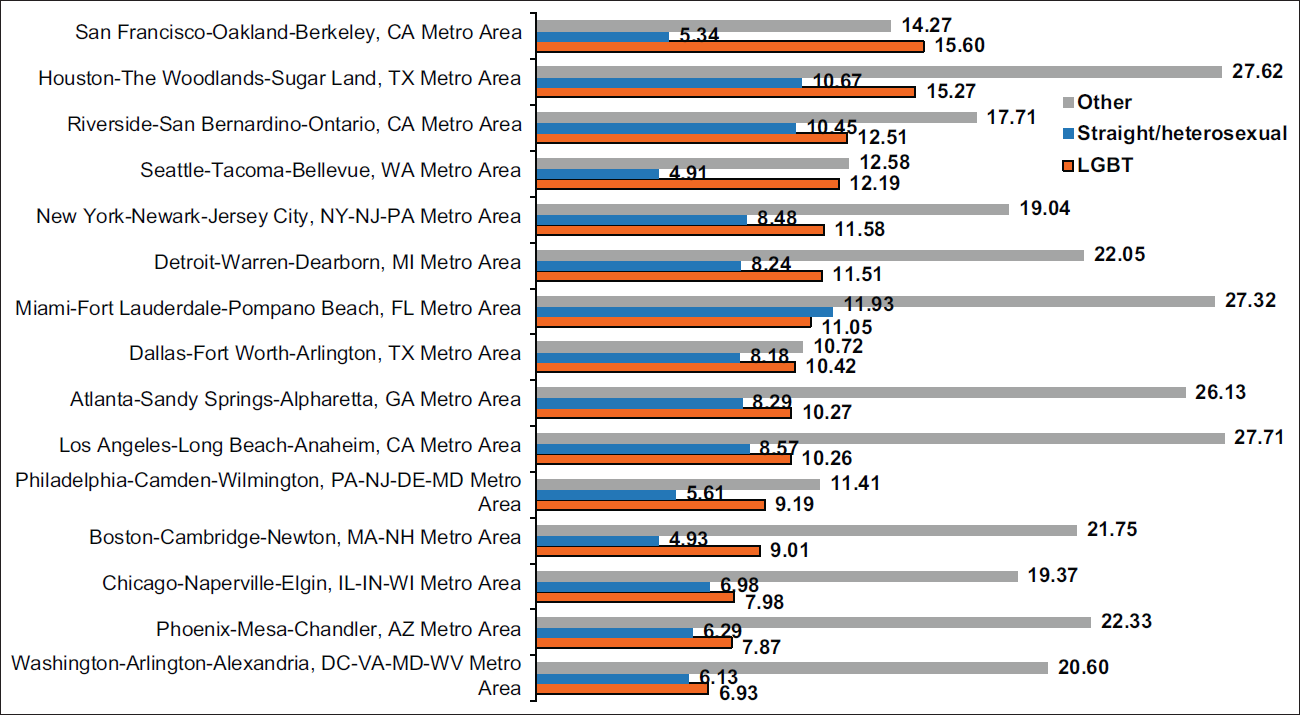
- Prevalence (%) of Food Insecurity among LGBT Adults ≥18 Years in 15 Largest Metropolitan Statistical Areas (MSAs), United States, July 21-October 11, 2021. Notes: Differences in prevalence of food insecurity by LGBT status were statistically significant at P<0.05 for Atlanta, Boston, Los Angeles, San Francisco Seattle, and Washington DC. Differences in food insecurity prevalence among straight adults across all MSAs were statistically significant at P<0.001. Differences in food insecurity among the “other” LGBT status category across all MSAs were not statistically significant at P<0.05. Source: Data derived from July 21-October 11, 2021 Household Pulse Survey
Statistical Methods
Multivariate logistic regression was used to model disparities in food insecurity after controlling for socioeconomic, demographic, and health care characteristics. Logistic models of food insecurity were fitted for the total population, the LGBT population only, and the population consisting of the 15 largest metropolitan areas. The Chi-square statistic was used to test the overall association between each covariate and food insecurity prevalence, whereas the two-sample t test was used to test the difference in prevalence between any two groups or geographic areas. To account for the complex sample design of the HPS, SUDAAN software was used to conduct all statistical analyses, including the logistic modeling procedure RLOGIST.25 Adjusted food insecurity prevalence estimates were derived by the logistic model at the mean values of the covariates.
Results
Sociodemographic Characteristics of LGBT and Straight/Heterosexual Populations
The LGBT population represented 7.90% of the total adult population (Table 1). LGBT and straight/heterosexual populations differed significantly in their sociodemographic characteristics. Compared with the straight population, LGBT adults, as a combined group, were more likely to be younger, non-Hispanic White, single, without health insurance, and had lower education, income, and home ownership rates, and higher unemployment and job losses (Table 1). There is substantial socioeconomic and demographic heterogeneity within the LGBT population. While Lesbian/gay adults had similar education and income levels as the straight population, transgender adults were particularly disadvantaged with respect to socioeconomic status, job loss, and lack of health insurance. About 24.7% of transgender adults were without a high school diploma, compared with 6.9% of the straight population, 7.4% of bisexual adults, and 8.6% of lesbian/gay adults. About 19.2% of transgender adults had annual household incomes <$25,000, compared with 10.1% of the straight population, 12.8% of lesbian/gay adults, and 15.4% of bisexual adults. Transgender adults were approximately two times more likely to experience recent household job losses or lack health insurance, compared with the straight population and lesbian/gay adults.
| Selected Characteristics | Total Population | All LGBTs | Lesbian/Gay | Bisexual | Transgender | Straight | Other | |||||||
|---|---|---|---|---|---|---|---|---|---|---|---|---|---|---|
| % | SE | % | SE | % | SE | % | SE | % | SE | % | SE | % | SE | |
| Sample size (unweighted) | 372,542 | 25,447 | 12,405 | 12,554 | 488 | 337,322 | 9,773 | |||||||
| Percentage of adult population (weighted) | 100.00 | 7.90 | 0.10 | 3.29 | 0.06 | 4.38 | 0.08 | 0.23 | 0.02 | 88.20 | 0.12 | 3.90 | 0.08 | |
| Number experiencing food insecurity (Unweighted) | 17,740 | 1,897 | 739 | 1,068 | 90 | 14,702 | 1,141 | |||||||
| Age 18-24 (%) | 9.21 | 0.14 | 24.85 | 0.66 | 14.82 | 0.87 | 32.23 | 0.93 | 27.52 | 3.75 | 7.33 | 0.13 | 20.00 | 1.02 |
| Age 25-34 (%) | 17.31 | 0.14 | 31.85 | 0.59 | 25.02 | 0.85 | 37.11 | 0.83 | 29.16 | 3.80 | 15.72 | 0.15 | 23.80 | 0.91 |
| Age≥65 (%) | 21.85 | 0.14 | 7.30 | 0.33 | 11.10 | 1.05 | 3.97 | 0.30 | 16.65 | 4.30 | 23.42 | 0.15 | 15.99 | 0.81 |
| Non-Hispanic White (%) | 62.63 | 0.18 | 61.05 | 0.67 | 60.06 | 1.02 | 62.59 | 0.90 | 45.73 | 4.47 | 63.50 | 0.19 | 46.05 | 1.07 |
| Non-Hispanic Black (%) | 11.30 | 0.12 | 8.45 | 0.36 | 9.18 | 0.55 | 7.81 | 0.48 | 10.20 | 2.60 | 11.73 | 0.13 | 7.28 | 0.53 |
| Asian (%) | 5.37 | 0.08 | 4.12 | 0.28 | 4.16 | 0.38 | 4.12 | 0.40 | 3.55 | 1.79 | 5.39 | 0.08 | 7.42 | 0.53 |
| Other and multiple race (%) | 3.70 | 0.07 | 5.38 | 0.28 | 4.72 | 0.47 | 5.87 | 0.36 | 5.53 | 1.37 | 3.40 | 0.07 | 7.16 | 0.47 |
| Hispanic (%) | 17.00 | 0.17 | 21.00 | 0.64 | 21.87 | 0.98 | 19.61 | 0.83 | 34.99 | 5.11 | 15.97 | 0.17 | 32.1 | 1.14 |
| Married (%) | 55.40 | 0.18 | 28.16 | 0.53 | 29.80 | 0.83 | 27.34 | 0.71 | 20.24 | 3.04 | 58.68 | 0.19 | 36.47 | 1.04 |
| Divorced/separated (%) | 13.53 | 0.11 | 10.20 | 0.36 | 8.96 | 0.45 | 10.70 | 0.49 | 18.57 | 4.46 | 13.82 | 0.12 | 13.73 | 0.71 |
| Single/never married (%) | 26.65 | 0.17 | 59.89 | 0.62 | 59.34 | 0.93 | 60.69 | 0.82 | 52.54 | 4.72 | 22.84 | 0.18 | 45.60 | 1.10 |
| Less than high school education (%) | 7.61 | 0.15 | 8.38 | 0.55 | 8.60 | 0.92 | 7.37 | 0.63 | 24.73 | 5.43 | 6.88 | 0.15 | 22.46 | 1.12 |
| College graduate or higher (%) | 31.08 | 0.13 | 30.41 | 0.49 | 35.54 | 0.8 | 26.67 | 0.62 | 28.25 | 3.23 | 31.53 | 0.14 | 22.15 | 0.63 |
| Household income <$25,000 (%) | 10.72 | 0.12 | 14.43 | 0.46 | 12.78 | 0.67 | 15.43 | 0.64 | 19.17 | 2.90 | 10.12 | 0.12 | 16.74 | 0.81 |
| Household income $25,000-34,999 (%) | 8.04 | 0.10 | 9.59 | 0.37 | 9.20 | 0.57 | 10.11 | 0.52 | 5.08 | 1.14 | 7.86 | 0.11 | 8.86 | 0.60 |
| Household income ≥$200,000 (%) | 6.00 | 0.06 | 4.89 | 0.21 | 6.70 | 0.33 | 3.50 | 0.27 | 5.53 | 1.65 | 6.19 | 0.06 | 4.12 | 0.41 |
| Not employed, 18-64 age group (%) | 32.72 | 0.20 | 32.74 | 0.68 | 32.11 | 1.07 | 32.59 | 0.91 | 46.57 | 4.31 | 32.17 | 0.21 | 44.23 | 1.22 |
| Homeowner (%) | 72.74 | 0.18 | 56.55 | 0.68 | 61.36 | 0.98 | 52.86 | 0.95 | 55.70 | 4.53 | 74.70 | 0.19 | 58.45 | 1.28 |
| Recent household job loss (%) | 16.75 | 0.15 | 21.10 | 0.60 | 19.70 | 0.91 | 21.56 | 0.79 | 33.19 | 4.61 | 15.86 | 0.15 | 28.47 | 1.08 |
| No health insurance (%) | 7.69 | 0.13 | 10.69 | 0.47 | 9.84 | 0.69 | 10.96 | 0.66 | 19.43 | 3.46 | 7.12 | 0.13 | 15.56 | 0.95 |
LGBT=Lesbian, gay, bisexual, and transgender. SE-Standard error All Chi-square tests for differences in characteristics by LGBT status were statistically significant at P<0.05.
Disparities in Prevalence and Odds of Food Insecurity During the Pandemic
The prevalence of food insecurity was 25.6% for transgender adults aged ≥18, significantly higher than that for lesbian/gay adults (11.6%), bisexual adults (13.5%), and straight/heterosexual adults (7.8%), and the total adult population (8.7%) (Table 2). After controlling for sociodemographic characteristics (i.e., age, race/ethnicity, marital status, region of residence, education, household income, housing tenure, household job/income loss, and health insurance status), lesbian/gay, bisexual, and transgender adults had, respectively, 36%, 35%, and 157% higher odds of food insecurity than their straight counterparts (Table 2). Other sociodemographic characteristics were associated with food insecurity. Those in younger ages, Black/African Americans, Hispanics, other and mixed-races, with lower SES, job losses, and without health insurance were significantly more likely to experience food insecurity (Table 2).
| Covariates | Unadjusted | Unadjusted | Adjusted | Adjusted | ||||||
|---|---|---|---|---|---|---|---|---|---|---|
| Prevalence | SE | OR | 95% | CI | OR2 | 95% | CI | Prevalence2 | SE | |
| Total population | 8.67 | 0.13 | ||||||||
| LGBT status | ||||||||||
| Lesbian/Gay | 11.60 | 0.71 | 1.55 | 1.34 | 1.78 | 1.36 | 1.15 | 1.61 | 10.35 | 0.62 |
| Bisexual | 13.49 | 0.74 | 1.84 | 1.62 | 2.09 | 1.35 | 1.17 | 1.56 | 10.29 | 0.54 |
| Transgender | 25.56 | 3.60 | 4.05 | 2.79 | 5.88 | 2.57 | 1.61 | 4.11 | 16.09 | 2.50 |
| Straight/heterosexual | 7.82 | 0.13 | 1.00 | reference | 1.00 | reference | 8.20 | 0.14 | ||
| Other | 20.29 | 1.03 | 3.00 | 2.64 | 3.42 | 1.89 | 1.62 | 2.20 | 13.07 | 0.68 |
| Age (years) | ||||||||||
| 18-24 | 11.11 | 0.61 | 2.41 | 3.22 | 2.58 | 4.03 | 1.27 | 2.17 | 7.53 | 0.43 |
| 25-34 | 10.64 | 0.36 | 2.19 | 3.07 | 2.51 | 3.76 | 1.70 | 2.73 | 9.21 | 0.32 |
| 35-44 | 11.33 | 0.33 | 2.23 | 3.29 | 2.70 | 4.02 | 2.15 | 3.37 | 10.88 | 0.31 |
| 45-54 | 10.21 | 0.29 | 2.30 | 2.93 | 2.40 | 3.57 | 2.02 | 3.14 | 10.36 | 0.30 |
| 55-64 | 7.65 | 0.24 | 1.98 | 2.13 | 1.75 | 2.60 | 1.50 | 2.30 | 8.21 | 0.26 |
| 65-74 | 4.42 | 0.24 | 1.25 | 1.19 | 0.96 | 1.48 | 0.99 | 1.57 | 5.96 | 0.31 |
| ≥75 | 3.73 | 0.34 | 1.00 | reference | 1.00 | reference | 4.96 | 0.45 | ||
| Race/ethnicity | ||||||||||
| Non-Hispanic White | 6.15 | 0.12 | 1.00 | reference | 1.00 | reference | 7.91 | 0.15 | ||
| Non-Hispanic Black | 15.99 | 0.50 | 2.90 | 2.67 | 3.15 | 1.48 | 1.35 | 1.64 | 10.68 | 0.35 |
| Asian | 4.60 | 0.40 | 0.74 | 0.61 | 0.88 | 0.82 | 0.67 | 1.00 | 6.75 | 0.55 |
| Other and multiple race | 14.78 | 0.79 | 2.65 | 2.33 | 3.01 | 1.68 | 1.45 | 1.95 | 11.70 | 0.62 |
| Hispanic | 13.93 | 0.45 | 2.47 | 2.27 | 2.69 | 1.15 | 1.04 | 1.27 | 8.79 | 0.30 |
| Marital status | ||||||||||
| Married | 1.63 | 1.4 | 1.00 | reference | 1.00 | reference | 7.52 | 0.19 | ||
| Widowed | 2.93 | 2.71 | 3.16 | 0.7 | 0.83 | 1.36 | 1.14 | 1.63 | 9.54 | 0.63 |
| Divorced/separated | 2.64 | 2.44 | 2.85 | 1.00 | 1.12 | 1.49 | 1.36 | 1.62 | 10.17 | 0.27 |
| Single | 2.06 | 1.5 | 2.85 | 1.03 | 1.13 | 1.29 | 1.17 | 1.42 | 9.14 | 0.26 |
| Geographic region | ||||||||||
| Northeast | 7.68 | 0.30 | 0.94 | 0.84 | 1.04 | 1.10 | 0.97 | 1.23 | 8.68 | 0.32 |
| South | 10.14 | 0.22 | 1.27 | 1.17 | 1.38 | 1.16 | 1.05 | 1.27 | 9.03 | 0.20 |
| Midwest | 7.52 | 0.21 | 0.92 | 0.84 | 1.00 | 1.09 | 0.98 | 1.20 | 8.62 | 0.23 |
| West | 8.16 | 0.26 | 1.00 | reference | 1.00 | reference | 8.09 | 0.25 | ||
| Education (years of school completed) | ||||||||||
| Less than high school (<12) | 22.27 | 0.92 | 10.58 | 9.43 | 11.87 | 3.16 | 2.71 | 3.69 | 11.85 | 0.61 |
| High school (12) | 12.06 | 0.30 | 5.06 | 4.70 | 5.45 | 2.53 | 2.33 | 2.76 | 10.04 | 0.24 |
| Some college (13-15) | 8.73 | 0.16 | 3.53 | 3.32 | 3.76 | 2.04 | 1.90 | 2.19 | 8.49 | 0.15 |
| College degree or higher (≥16) | 2.64 | 0.06 | 1.00 | reference | 1.00 | reference | 4.71 | 0.13 | ||
| Household income in 2020 ($) | ||||||||||
| <25,000 | 25.47 | 0.55 | 28.30 | 20.91 | 38.30 | 7.57 | 5.58 | 10.27 | 16.32 | 0.43 |
| 25,000-34,999 | 14.30 | 0.48 | 13.82 | 10.17 | 18.79 | 4.75 | 3.49 | 6.46 | 11.49 | 0.41 |
| 35,000-49,999 | 9.91 | 0.36 | 9.11 | 6.70 | 12.39 | 3.77 | 2.79 | 5.10 | 9.56 | 0.35 |
| 50,000-74,999 | 5.33 | 0.24 | 4.66 | 3.41 | 6.37 | 2.44 | 1.81 | 3.30 | 6.65 | 0.29 |
| 75,000-99,999 | 2.58 | 0.18 | 2.19 | 1.58 | 3.04 | 1.41 | 1.03 | 1.93 | 4.09 | 0.28 |
| 100,000-149,999 | 1.26 | 0.13 | 1.05 | 0.74 | 1.51 | 0.80 | 0.57 | 1.14 | 2.45 | 0.25 |
| 150,000-199,999 | 1.15 | 0.29 | 0.97 | 0.54 | 1.73 | 0.72 | 0.40 | 1.29 | 2.20 | 0.56 |
| ≥200,000 | 1.19 | 0.18 | 1.00 | reference | 1.00 | reference | 3.00 | 0.42 | ||
| Unknown | 11.01 | 0.39 | 10.25 | 7.54 | 13.94 | 2.71 | 1.96 | 3.74 | 7.27 | 0.35 |
| Housing tenure | ||||||||||
| Owner | 4.70 | 0.11 | 1.00 | reference | 1.00 | reference | 6.82 | 0.18 | ||
| Renter | 16.11 | 0.32 | 3.89 | 3.64 | 4.17 | 1.56 | 1.43 | 1.69 | 9.66 | 0.22 |
| Recent household job loss | ||||||||||
| Yes | 23.89 | 0.48 | 5.24 | 4.91 | 5.60 | 2.87 | 2.67 | 3.09 | 14.93 | 0.33 |
| No | 5.65 | 0.11 | 1.00 | reference | 1.00 | reference | 6.55 | 0.13 | ||
| Health insurance status | ||||||||||
| Insured | 6.89 | 0.11 | 1.00 | reference | 1.00 | reference | 8.05 | 0.14 | ||
| Not insured | 23.61 | 0.77 | 4.17 | 3.81 | 4.57 | 1.51 | 1.35 | 1.68 | 10.97 | 0.40 |
LGBT=Lesbian, gay, bisexual, and transgender SE=standard error. OR=odds ratio; CI=confidence interval. Chi-square statistics for testing the overall association between each covariate and prevalence of food insecurity were statistically significant at P<0.001. 1Odds ratios (ORs) estimated by the logistic model were unadjusted for the effects of other covariates. 2Adjusted for LGBT status, age, race/ethnicity, marital status, region of residence, education, household income, housing tenure, household job/income loss, and insurance status.
Predictors of Food Insecurity among LGBT Adults During the Pandemic
Black/AfricanAmerican, Hispanic, or mixed race/ethnicity, lower education and income, lack of home ownership, divorce/separation, lack of health insurance, and recent job loss were significant predictors of food insecurity among LGBT adults (Table 3). About 21.7% of Black/ African American LGBT adults reported experiencing food insecurity, significantly higher than non-Hispanic White LGBTs (10.1%) and Asian LGBTs (8.1%). After adjusting for covariates, LGBT adults who were Black/ African American, other and mixed races, or Hispanic had, respectively, 45%, 41%, and 31% higher adjusted odds of food insecurity than their non-Hispanic White counterparts.
| Covariates | Unadjusted | Unadjusted | Adjusted | Adjusted | ||||||
|---|---|---|---|---|---|---|---|---|---|---|
| Prevalence | SE | OR1 | 95% | CI | OR2 | 95% | CI | Prevalence2 | SE | |
| Age (years) | ||||||||||
| 18-24 | 13.47 | 1.33 | 0.69 | 0.36 | 1.33 | 0.69 | 0.32 | 1.52 | 11.86 | 1.11 |
| 25-34 | 13.54 | 0.86 | 0.69 | 0.37 | 1.31 | 0.87 | 0.41 | 1.84 | 13.93 | 0.90 |
| 35-44 | 14.77 | 1.15 | 0.77 | 0.40 | 1.46 | 1.04 | 0.49 | 2.21 | 15.77 | 1.12 |
| 45-54 | 14.25 | 1.70 | 0.74 | 0.37 | 1.45 | 0.84 | 0.38 | 1.82 | 13.56 | 1.37 |
| 55-64 | 8.57 | 0.99 | 0.41 | 0.21 | 0.81 | 0.53 | 0.23 | 1.20 | 9.70 | 1.32 |
| 65-74 | 4.84 | 1.10 | 0.23 | 0.10 | 0.49 | 0.28 | 0.11 | 0.72 | 5.90 | 1.50 |
| ≥75 | 18.43 | 4.77 | 1.00 | reference | 1.00 | reference | 15.36 | 3.90 | ||
| Race/ethnicity | ||||||||||
| Non-Hispanic White | 10.06 | 0.54 | 1.00 | reference | 1.00 | reference | 11.80 | 0.60 | ||
| Non-Hispanic Black | 21.71 | 2.00 | 2.48 | 1.91 | 3.21 | 1.45 | 1.08 | 1.95 | 15.36 | 1.49 |
| Asian | 8.13 | 2.99 | 0.79 | 0.36 | 1.75 | 1.04 | 0.46 | 2.35 | 12.11 | 3.69 |
| Other and multiple race | 16.81 | 2.03 | 1.81 | 1.33 | 2.45 | 1.41 | 1.03 | 1.95 | 15.11 | 1.60 |
| Hispanic | 18.86 | 1.60 | 2.08 | 1.64 | 2.63 | 1.31 | 1.00 | 1.71 | 14.31 | 1.20 |
| Marital status | ||||||||||
| Married | 8.58 | 0.68 | 1.00 | reference | 1.00 | reference | 12.05 | 0.9 | ||
| Widowed | 22.23 | 4.52 | 3.05 | 1.78 | 5.23 | 2.09 | 1.05 | 4.20 | 19.90 | 4.30 |
| Divorced/separated | 20.02 | 1.83 | 2.67 | 2.01 | 3.54 | 1.58 | 1.18 | 2.12 | 16.59 | 1.39 |
| Single | 13.78 | 0.73 | 1.70 | 1.38 | 2.10 | 1.05 | 0.82 | 1.35 | 12.51 | 0.65 |
| Geographic region | ||||||||||
| Northeast | 12.24 | 1.30 | 1.04 | 0.77 | 1.39 | 1.14 | 0.83 | 1.58 | 20.13 | 2.42 |
| South | 14.70 | 0.94 | 1.28 | 1.02 | 1.61 | 1.16 | 0.90 | 1.49 | 16.98 | 1.16 |
| Midwest | 12.29 | 1.02 | 1.04 | 0.81 | 1.35 | 1.03 | 0.78 | 1.35 | 11.76 | 0.65 |
| West | 11.84 | 0.93 | 1.00 | reference | 1.00 | reference | 7.08 | 0.53 | ||
| Education (years of school completed) | ||||||||||
| Less than high school (<12) | 32.62 | 3.66 | 9.97 | 6.97 | 14.28 | 3.99 | 2.68 | 5.93 | 11.85 | 0.61 |
| High school (12) | 20.11 | 1.45 | 5.18 | 4.11 | 6.53 | 3.10 | 2.41 | 4.00 | 10.04 | 0.24 |
| Some college (13-15) | 12.01 | 0.65 | 2.81 | 2.32 | 3.41 | 1.88 | 1.50 | 2.35 | 8.49 | 0.15 |
| College degree or higher (≥16) | 4.63 | 0.34 | 1.00 | reference | 1.00 | reference | 4.71 | 0.13 | ||
| Household income in 2020 ($) | ||||||||||
| <25,000 | 30.82 | 1.68 | 15.25 | 7.03 | 33.10 | 7.37 | 3.60 | 15.10 | 23.15 | 1.40 |
| 25,000-34,999 | 17.07 | 1.46 | 7.05 | 3.21 | 15.46 | 4.45 | 2.16 | 9.17 | 16.41 | 1.34 |
| 35,000-49,999 | 13.70 | 1.37 | 5.43 | 2.46 | 12.00 | 3.55 | 1.70 | 7.41 | 13.92 | 1.39 |
| 50,000-74,999 | 8.67 | 1.40 | 3.25 | 1.41 | 7.48 | 2.62 | 1.23 | 5.57 | 11.03 | 1.48 |
| 75,000-99,999 | 3.97 | 0.84 | 1.42 | 0.59 | 3.39 | 1.41 | 0.63 | 3.13 | 6.63 | 1.27 |
| 100,000-149,999 | 2.17 | 0.57 | 0.76 | 0.30 | 1.92 | 0.91 | 0.39 | 2.13 | 4.52 | 1.13 |
| 150,000-199,999 | 3.08 | 1.95 | 1.09 | 0.25 | 4.83 | 1.49 | 0.35 | 6.46 | 6.97 | 4.02 |
| 2200,000 | 2.84 | 1.07 | 1.00 | reference | 1.00 | reference | 4.93 | 1.55 | ||
| Unknown | 15.02 | 1.56 | 6.05 | 2.73 | 13.41 | 1.96 | 0.90 | 4.25 | 8.74 | 1.16 |
| Housing tenure | ||||||||||
| Owner | 7.29 | 0.56 | 1.00 | reference | 1.00 | reference | 9.98 | 0.73 | ||
| Renter | 16.95 | 0.85 | 2.59 | 2.12 | 3.17 | 1.43 | 1.15 | 1.78 | 13.05 | 0.69 |
| Recent household job loss | ||||||||||
| Yes | 29.17 | 1.63 | 4.35 | 3.59 | 5.27 | 2.82 | 2.29 | 3.47 | 21.02 | 1.20 |
| No | 8.65 | 0.46 | 1.00 | reference | 1.00 | reference | 9.87 | 0.52 | ||
| Health insurance status | ||||||||||
| Insured | 10.64 | 0.48 | 1.00 | reference | 1.00 | reference | 12.19 | 0.57 | ||
| Not insured | 27.78 | 2.28 | 3.23 | 2.53 | 4.13 | 1.57 | 1.19 | 2.08 | 16.73 | 1.49 |
LGBT=Lesbian, gay, bisexual, and transgender SE=standard error OR=odds ratio; CI=confidence interval. Chi-square statistics for testing the overall association between each covariate and prevalence of food insecurity were statistically significant at P<0.001, except for region (P=0.119). 1Odds ratios (ORs) estimated by the logistic model were unadjusted for the effects of other covariates. 2Adjusted for age, race/ethnicity, marital status, region of residence, education, household income, housing tenure, household job/income loss, and insurance status.
LGBT adults who experienced divorce or separation had 58% higher adjusted odds of food insecurity than their married counterparts. Education and income levels were strongly and consistently linked to food insecurity in LGBT adults. Prevalence of food insecurity varied from 32.6% in LGBT adults with less than a high school education to 4.6% among LGBT adults with at least a college degree. Prevalence of food insecurity varied from 30.8% in LGBT adults with household income <$25,000 to 2.8% among LGBT adults with household income ≥$200,000 (Table 3). After adjusting for covariates, LGBT adults with less than a high education or with a high school diploma had had 4.0 and 3.1 times higher odds of food insecurity respectively than those with at least a college degree. LGBT adults with household income <$25,000 or $25,000-$34,999 had 7.4 and 4.5 times higher adjusted odds of food insecurity respectively than those with household income ≥$200,000.
About 29.2% of LGBT adults who experienced recent household job loss reported food insecurity, compared with 8.7% of LGBT adults who did not experience job loss. Controlling for covariates, LGBT adults with recent job losses had 2.8 higher odds of experiencing food insecurity than their counterparts without job loss. LGBT adults who did not have health insurance had 57% higher adjusted odds of food insecurity than those with health insurance (Table 3).
Prevalence and Odds of Food Insecurity During the Pandemic by LGBT Status in 15 Largest US Metropolitan Areas
Inequalities in food insecurity by LGBT status in the 15 largest US metropolitan areas as a whole were similar to those for the total population. The prevalence of food insecurity in metropolitan areas was 28.5% for transgender adults aged ≥18, significantly higher than that for lesbian/gay adults (10.6%), bisexual adults (10.2%), and straight/heterosexual adults (7.9%) (Table 4). After adjusting for covariates, lesbian/gay and transgender adults in large metropolitan areas had, respectively, 36% and 192% higher odds of food insecurity than their straight counterparts.
| LGBT status | Unadjusted | Unadjusted | Adjusted | Adjusted | ||||||
|---|---|---|---|---|---|---|---|---|---|---|
| Prevalence | SE | OR1 | 95% | CI | OR2 | 95% | CI | Prevalence2 | SE | |
| Total population | 8.63 | 0.21 | ||||||||
| LGBT status | ||||||||||
| Lesbian/Gay | 10.58 | 1.19 | 1.38 | 1.07 | 1.77 | 1.36 | 1.01 | 1.82 | 10.35 | 1.10 |
| Bisexual | 10.16 | 1.04 | 1.32 | 1.05 | 1.66 | 1.06 | 0.82 | 1.37 | 8.61 | 0.82 |
| Transgender | 28.50 | 7.73 | 4.64 | 2.20 | 9.79 | 2.92 | 1.06 | 8.01 | 17.40 | 5.61 |
| Straight/heterosexual | 7.91 | 0.22 | 1.00 | reference | 1.00 | reference | 8.23 | 0.23 | ||
| Other | 20.62 | 1.64 | 3.03 | 2.46 | 3.72 | 1.84 | 1.46 | 2.33 | 12.87 | 1.00 |
LGBT=Lesbian, gay, bisexual, and transgender. SE=standard error OR=odds ratio; CI=confidence interval. Chi-square statistics for testing the overall association between LGBT status and prevalence of food insecurity were statistically significant at Р<0.001. 1Odds ratios (ORs) estimated by the logistic model were unadjusted for the effects of other covariates. 2Adjusted for LGBT status, age, race/ethnicity, marital status, region of residence, education, household income, housing tenure, household job/income loss, and insurance status.
LGBT adults experienced higher levels of food insecurity compared to the straight population in several US metropolitan areas, including Atlanta, Georgia; Boston, Massachusetts; Los Angeles, California; San Francisco, California; Seattle, Washington; and Washington, DC (Figure 1). The prevalence of food insecurity among the LGBT population varied from a low of 6.9% in Washington, DC to 15.6% in San Francisco, CA. However, differences in food insecurity prevalence across the 15 US metropolitan areas were not statistically significant owing to small sample numbers of those with food insecurity in each metropolitan area. The prevalence of food insecurity among the straight population ranged from a low of 4.9% in Seattle, Washington to 11.9% in Miami, Florida, with differences across the metro areas being statistically significant (Figure 1).
Reasons for Food Insecurity and Receipt of Food Assistance During the Pandemic According to LGBT Status
Not being able to afford to buy more food was the primary reason for both LGBT and straight populations reporting food insecurity. Compared to the straight population (58.1%), 69.1% of lesbian/gay adults and 67.4% of bisexual adults reported this specific reason (Figure 2). The second important reason specified for food security was not being able to get to the store to buy food because the respondent did not have transportation, had mobility, or health limitations. Transgender (20.1%) and bisexual adults (17.7%) were about twice as likely to report this specific condition as straight adults (9.4%) as the reason for food insecurity. The third important reason given for food insecurity was not being able to go to the store due to safety concerns and delivery of groceries not available to the neighborhood of residence. This was a significantly greater concern among transgender and bisexual adults compared to straight adults.

- Reasons for Food Insecurity, and Food Assistance among LGBT and Straight/Heterosexual Adults ≥18 Years, United States, July 21-October 11, 202. Notes: Differences in each reported reason for food insecurity by LGBT status were statistically significant at P<0.001. Differences in the percentage of households receiving free groceries or meals or SNAP by LGBT status were statistically significant at P<0.001. Source: Data derived from July 21-October 11, 2021 Household Pulse Survey.
Transgender and bisexual adults with food insecurity were more likely to report receiving free groceries or free meals than lesbian/gay and straight adults. About 33.3% of the LGBT population that experienced food insecurity reported their households receiving SNAP benefits, compared with 13.6% of the food-secure LGBT population (Figure 2). Reported participation in the SNAP program varied within the LGBT population, from a high of 36.3% of food-insecure bisexual adults to a low of 15.6% of food-insecure transgender adults. Participation in the SNAP program was lower among food-insecure and food-secure straight adults compared with their LGBT counterparts.
Discussion
Our study has shown substantially higher risks of food insecurity among LGBT adults in the US compared to their straight/heterosexual counterparts. Estimates of food insecurity prevalence and its correlates for LGBT adults during the pandemic had not been previously available at the national level, and comparison of food insecurity rates for LGBTs with those of the straight population had not been made by controlling for differences in sociodemographic and health care characteristics. According to our analysis, 8.7% of all US adults or 18.3 million adults experienced food insecurity during July-October 2021. Of the 18.3 million food-insecure adults, 2.2 million were LGBT people and 14.4 million were straight adults.
Our study confirmed findings from previous studies that showed significant socioeconomic and health disparities among LGBT adults. Our study is one of the few studies that have examined food insecurity disparities in the LGBT population by using nationally representative samples.14-16 Documenting new national estimates and correlates of food insecurity among LGBT adults in the US, and those in the largest metropolitan areas, is new to the literature.
Socioeconomic gradients in food insecurity shown here are consistent with those reported previously for the US, where men and women in lower-income or socioeconomic groups had a higher prevalence of food insecurity than their counterparts from higher SES groups.5,14-16 Consistent with prior studies, LGBT individuals experience higher levels of food insecurity, poverty, unemployment, and SNAP participation than their straight counterparts.14,26 Our study findings regarding higher rates of food insecurity for racial/ethnic minorities such as Black/African Americans, Hispanics, and mixed-race individuals for the general population as well as within the LGBT population are consistent with prior studies.5,7,20
A significant percentage of both LGBT and straight adults with food insecurity have not taken advantage of federal assistance programs, including participation in the SNAP program, during the ongoing pandemic. The reasons for low SNAP participation among the population experiencing food insecurity needs to be investigated using data for a longer time span of the ongoing pandemic. At the federal level, expansion in eligibility for unemployment insurance, economic impact payments, an increase in SNAP payments under the Families First Coronavirus Act (FFCRA) and the Coronavirus Aid, Relief, or Economic Security (CARES) Act during the pandemic, might have helped reduce food insecurity during the study period.27,28 In addition, food insecurity interventions by the Medicaid managed care organizations (MCOs) might be effective such as donating money to food- related nonprofits, with states' support such as expanding waiver of nutritional services or through a partnership with community-based organizations.29 It would be worthwhile to estimate the effects of these federal, state, local, or MCOs' interventions on food insecurity.
Limitations
This study has several limitations. Estimates of food insecurity prevalence from the HPS are based on self-reports, which may not accurately estimate the actual prevalence of food insecurity among various sociodemographic groups, including LGBT adults, when compared with direct measures such as food calorie intake and food expenditure.30 Singleitem measures of food insecurity used in our study may also underestimate the prevalence based on more comprehensive, multi-item measures used by USDA.5,11,31
Second, the LGBT status, defined in our study, includes a residual “other” category that represents 3.9% of the total adult population and that has high levels of social disadvantage and food insecurity - almost similar to those observed for transgender adults. Specific sexual orientation or gender identity of this “other” group (such as queer, or questioning (LGBTQ+) individuals) remains unknown. Third, immigrant/citizenship status, one of the important factors associated with food insecurity in the US, is not available in HPS.29 Fourth, our definition of food insecurity is dichotomous and does not consider a broader, more detailed definition of food insecurity (such as low food security and very low food security) due to lack of such data in HPS. Future research may consider the four-level food insecurity variable in HPS to determine how various LGBT groups might differ from their straight/heterosexual counterparts across the food-security/insecurity continuum.
Fifth, the reference period for defining food insecurity during the past 7 days, used in HPS, may underestimate the level of food insecurity in comparison to the reference periods (such as the past month or past year) used to define food insecurity in other federal surveys such as the Current Population Survey (CPS) or the Behavioral Risk Factor Surveillance System (BRFSS), although the temporary or variable nature of food insecurity may persist over time.5 For example, in 2020, the USDA prevalence estimates for household food insecurity based on annual and 30-day periods in the CPS were 10.5% and 5.7%.11 However, HPS, being the first federal survey to collect current food insecurity using the 7-day reference period prior to the survey,5 may have an advantage over other surveys for tracking fluctuations in current food insecurity during the pandemic using weekly or biweekly surveys.
Sixth, because of the small sample size for the LGBT population, we were unable to examine if patterns of food insecurity among LGBT varied across racial/ethnic and socioeconomic groups. This needs to be examined in future studies. Finally, exclusion of the institutionalized population or homeless individuals from HPS may have underestimated the level of food insecurity reported in our study.
Conclusions and Implications for Translation
Significant disparities in food insecurity exist, with LGBT adults, particularly transgender adults, at substantially increased risk of experiencing food insecurity, economic hardship, and social disadvantage during the pandemic and likely in greater need of social and public assistance. Health policies aimed at improving the social, material, and built environmental conditions may lead to improved food security and health outcomes among LGBT adults and the general US population. Our results show how reduced access to transportation, reduced mobility due to health limitations, and neighborhood safety concerns contribute to high levels of food insecurity among LGBT adults. Effective policies aimed at improving the social and built environmental aspects of food security are needed.
Continued monitoring of social conditions, food insecurity, and associated outcomes among sexual minorities are essential in tracking progress towards achieving the national goal of eliminating health inequities.7,20 Increasingly, a number of federal, state, and community health surveys have started to include variables on sexual orientation and gender identity, which would aid in monitoring health surveillance efforts and a better understanding of health, health care, and social needs of the LGBT population, including food security.7,20
Compliance with Ethical Standards
Conflicts of Interest:
The authors declare that they have no conflict of interest.
Financial Disclosure:
None to report.
Ethical approval:
No IRB approval was required for this study, which is based on the secondary analysis of a public- use federal database.
Disclaimer:
The views expressed are the authors' and not necessarily those of their institutions.
Acknowledgments:
None.
Funding/Support:
None.
References
- Growing job-related income losses, increasing social inequalities, and physical and mental health impact during the COVID-19 pandemic, United States, April-December 2020. Int J Transl Med Res Public Health. 2021;5(2):76-89.
- [CrossRef] [Google Scholar]
- Increasing trends in physical and mental health problems among US workers in different job sectors during the COVID-19 pandemic. Int J Transl Med Res Public Health. 2021;5(2):90-102.
- [CrossRef] [Google Scholar]
- The State of Food Security and Nutrition in the World 2021: Transforming Food Systems for Food Security, Improved Nutrition and Affordable Healthy Diets for All. (accessed )
- Food Security and COVID-19. The World Bank; Published 2021 (accessed )
- Household Food Security in the United States in 2020. Washington, DC: USDA Economic Research Service; 2021. Economic Research Report No. 298
- Measuring Household Experiences during the Coronavirus Pandemic: Household Pulse Survey. United States Census Bureau; (accessed )
- 2020. Food Insecurity Healthy People. (accessed )
- Food insecurity is adversely associated with psychological distress, anxiety and depression during the COVID-19 pandemic. Prev Med Reports. 2021;24:101547.
- [CrossRef] [PubMed] [Google Scholar]
- Social determinants of health associated with mental health among U.S. mothers with children aged 0-5 years. J Women's Health. 2020;29(8):1039-1051.
- [CrossRef] [PubMed] [Google Scholar]
- Impact of food insecurity-related intervention on mental health among US adults during the COVID-19 pandemic using the National Household Pulse Survey. Paper presented at the. National Institutes of Health (NIH) Virtual Workshop: Food Insecurity, Neighborhood Food Environment, and Nutrition Health Disparities: State of the Science 2021 September 21-23
- [Google Scholar]
- Statistical Supplement to Household Food Security in the United States in 2020. Washington, DC: USDA Economic Research Service; 2021. Economic Research Report No. AP-091
- Predictors of households at risk for food insecurity in the United States during the COVID-19 pandemic. Public Health Nutr. 2021;24(12):3929-3936.
- [CrossRef] [PubMed] [Google Scholar]
- Assessing food insecurity among US adults during the COVID-19 pandemic. J Hunger Environ Nutr. 2021;16(1):1-18.
- [CrossRef] [Google Scholar]
- Household Pulse Survey Shows LGBT Adults More Likely to Report Living in Households With Food and Economic Insecurity Than Non-LGBT Respondents. United States Census Bureau; Published August 11, 2021 (accessed )
- Disparities in food insecurity at the intersection of race and sexual orientation: A population-based study of adult women in the United States. SSM-Popul Health. 2020;12:100655.
- [CrossRef] [PubMed] [Google Scholar]
- Prevalence of social determinants of health among sexual minority women and men in 2017. Am J Prev Med. 2020;59(1):118-122.
- [CrossRef] [PubMed] [Google Scholar]
- LGBT Identification Rises to 5.6% in Latest U.S. Estimate Gallup Poll. Published February 24, 2021 (accessed )
- Food insecurity and food pantry use among transgender and gender non-conforming people in the Southeast United States. BMC Public Health. 2020;20(1):590.
- [CrossRef] [PubMed] [Google Scholar]
- Health Resources and Services Administration. Office of Health Equity. 2020. Health Equity Report, 2019-2020: Special Feature on Housing and Health Inequalities. (accessed )
- [Google Scholar]
- Lesbian, Gay, Bisexual, and Transgender Health. Healthy People 2020. (accessed )
- Household Pulse Survey Data Dictionary for SAS - Phase 3.2, Weeks 34-39, July 21-October 11, 2021. United States Census Bureau; (accessed )
- Design and Operation of the 2020 Household Pulse Survey. United States Census Bureau; 2020. Forthcoming (accessed )
- Disparities in psychological distress impacting lesbian, gay, bisexual and transgender cancer survivors. Psychooncology. 2015;24(11):1384-1391.
- [CrossRef] [PubMed] [Google Scholar]
- Social determinants of health in the United States: addressing major health inequality trends for the nation, 1935-2016. Int J MCH AIDS. 2017;6(2):139-164.
- [CrossRef] [Google Scholar]
- SUDAAN: Software for the Statistical Analysis of Correlated Data, Release 11.0.3. Research Triangle Park, NC: Research Triangle Institute; 2018.
- [Google Scholar]
- One of Us. Published 2021 (accessed )
- The Social Safety Net in the Wake of COVID-19. National Bureau of Economic Research; 2020.
- [CrossRef]
- Food insecurity during the COVID-19 pandemic: evidence from a survey of low-income Americans. Food Secur 2021:1-19.
- [CrossRef] [PubMed] [Google Scholar]
- Combating food insecurity during the COVID-19 pandemic and beyond: MCO efforts and initiatives. NORC at the University of Chicago; Published January 2021 (accessed )
- Biases in self-reported food insecurity measurement: A list experiment approach. Food Policy. 2020;92:101862.
- [CrossRef] [Google Scholar]
- Single-item measure of food insecurity used in the National Health Survey may underestimate prevalence in Australia. Aust NZ J Public Health. 2018;42(4):389-395.
- [CrossRef] [PubMed] [Google Scholar]