Translate this page into:
State and Metropolitan Area Disparities in Long COVID-19 and Related Symptoms among US Adults, June-October 2022
✉Corresponding author email: gsingh@mchandaids.org.
Abstract
Background:
Little research exists on sociodemographic and geographic inequalities in Long COVID, defined as COVID-19 symptoms lasting 3 months or longer. Using the latest nationally representative data, we examine geographic disparities in prevalence of Long COVID and severe COVID symptoms among United States (US) adults aged ≥18 years.
Methods:
We analyzed five consecutive rounds of the US Census Bureau's Household Pulse Survey from June 1 to October 17, 2022 (N=108,064). Using multivariable logistic regression and health disparity indices, we modeled disparities in Long COVID and severe COVID symptoms by state and metropolitan area, controlling for race/ethnicity, socioeconomic status, health insurance, and other demographic characteristics.
Results:
During June-October 2022, an estimated 35.4 million or 32.2% of COVID patients in the US reported developing Long COVID; and 15.2 million or 13.8% of COVID patients reported experiencing severe COVID symptoms. The prevalence of Long COVID ranged from 24.0% in the District of Columbia (DC), 25.4% in Hawaii to 39.2% in Alabama, 39.9% in Wyoming, and 43.6% in West Virginia. Adjusted for covariates, adults with COVID-19 diagnosis in Alabama, Wyoming, and West Virginia had 48-178% higher adjusted odds of developing Long COVID than their counterparts in DC. Adults with COVID-19 diagnosis in Alabama, Arkansas, Colorado, Iowa, Kentucky, Mississippi, Montana, North Dakota, South Dakota, Texas, Utah, Virginia, Wyoming, and West Virginia had 2.0-2.5 times higher adjusted odds of experiencing severe COVID symptoms than their counterparts in Vermont. Large disparities in prevalence of Long COVID and severe COVID symptoms existed among the 15 largest metropolitan areas of the US, with the prevalence of Long COVID ranging from 21.9% in San Francisco to 38.0% in Riverside, California. Socioeconomic, demographic and health insurance characteristics explained 34% of the state-level disparity and 45% of the metropolitan-area disparity in Long COVID prevalence.
Conclusion and Implications for Translation:
Marked geographic disparities existed, with COVID patients/survivors in the Southeast, Southwest, and Northern Plains states being at substantially higher risks of developing Long COVID and severe COVID symptoms. Equitable access to care and support services among patients with Long COVID is critical to reducing inequities in COVID-related health outcomes.
Keywords
Long COVID
COVID-19 Pandemic
Disease Severity
Geographic Disparities
Social Determinants

1. Introduction
The coronavirus disease (COVID-19) pandemic has had a devastating impact on people's health and wellbeing in the US and globally since the start of the pandemic three years ago, resulting in massive social and economic disruptions and costs (estimated at 16 trillion dollars for the US alone), social isolation, mental health problems, reduced access to healthcare and welfare services, excess premature mortality, and declines in life expectancy.1-10 US has been greatly affected by the pandemic, with 101.4 million confirmed COVID-19 cases and 1.1 million deaths as of January 10, 2023,8 in comparison to 660,378,145 confirmed cases and 6,691,495 deaths globally.2
Although the disease burden associated with COVID-19 cases, deaths, and hospitalizations has been substantial,11 Long COVID has affected nearly 36 million COVID-19 survivors in the US, leading to considerable suffering and disabilities.12-14 Long COVID, also called post-COVID conditions, is considered a “multifaceted disease,” with COVID-19 symptoms lasting 3 months or longer, and sometimes manifesting as new chronic conditions, including heart disease, diabetes, kidney disease, hematologic disorders, and mental and neurological conditions.13-16
Among the most-commonly-reported symptoms of Long COVID include fatigue, chest pain, trouble breathing and cough, trouble thinking and concentrating (“brain fog”), headaches, dizziness, sleep problems, muscle aches, stomach pain, and diarrhea.16-18 A newly released study attributed 3,544 US deaths to Long COVID between January 2020 and July 2022.19 Long COVID has also had a substantial economic impact, with 4 million Americans reported to be out of work due to Long COVID, costing $170 billion to $230 billion annually in lost wages, and significant income loss, shortage of workers, and a surge in inflation.20,21
Although inequalities in the prevalence of Long COVID among US adults have been documented to some extent by such sociodemographic factors as age, gender, race/ethnicity, education, and household income,12 geographic disparities in Long COVID and the related disease severity have not yet been analyzed. Geographic disparities in Long COVID may be due to differences in socioeconomic and demographic factors, health-risk behaviors, state- and community-specific policies in preventive COVID- related behaviors such as social and physical distancing, face-mask use, COVID-19 vaccinations, and access to health insurance and primary/specialized care.9,22-24
Analyses of geographic disparities in Long COVID are critical to identifying underserved areas and populations with a disproportionate disease burden and to demonstrate the need for a more equitable access to healthcare, treatment, and social services to promote health equity and to reduce disparities in COVID-related health outcomes.5,9,13-15,22,25,26 To address the existing gaps in research and to provide new insights into surveillance and epidemiology of Long COVID, we use a large nationally representative survey to examine state and metropolitan area disparities in Long COVID and disease severity among US adults aged ≥18 years during the ongoing coronavirus pandemic.
2. Methods
2.1. Data
We used pooled data from five consecutive samples of the US Census Bureau's Household Pulse Survey (HPS) conducted during June to October 2022. The five independent HPS samples that included information on COVID-19 diagnosis, Long COVID, and severity of COVID symptoms among adults aged ≥18 years were: Week 46, June 1-13; Week 47, June 29-July 11; Week 48, July 27- August 8; Week 49, September 14-28; and Week 50, October 5-17, 2022.27 The HPS is a national sample household survey in which data on socioeconomic, demographic, physical and mental health, food insecurity, childcare, and healthcare characteristics, including health insurance coverage, COVID-19 diagnosis and vaccination, and access to telehealth during the COVID-19 pandemic are collected in near real time via email and internet. The HPS was developed as a rapid response survey, in partnership with several federal statistical agencies, to track social and economic impacts of the COVID-19 pandemic on American households on a weekly or a bi-weekly basis.28,29 Information collected in the survey is based on self-reports by respondents aged 18 years and older. The HPS employs a systematic sample design, ensuring its representativeness of the US civilian non-institutionalized population. Substantive and methodological details of the survey are available elsewhere. 27-29
2.2. Measurement of the Outcome Variables: Long COVID and COVID Disease Severity
We used two COVID-related binary outcome variables. The first outcome variable, Long COVID, was based on the question, “Did you have any symptoms lasting 3 months or longer that you did not have prior to having coronavirus or COVID-19? Long term symptoms may include tiredness or fatigue, difficulty thinking, concentrating, forgetfulness, or memory problems (sometimes referred to as “brain fog,” difficulty breathing or shortness of breath, joint or muscle pain, fast-beating or pounding heart (also known as heart palpitations), chest pain, dizziness on standing, menstrual changes, changes to taste/smell, or inability to exercise.” COVID patients responding “yes” were defined as having Long COVID and those with “no” response were considered not to have Long COVID.
The second outcome variable, disease severity (i.e., severe COVID symptoms), was based on the question,“How would you describe your coronavirus symptoms when they were at their worst?” Respondents who reported severe symptoms were defined as having severe COVID symptoms, and those reporting no, mild or moderate symptoms as not having severe symptoms.
The pooled sample size from June-October 2022 HPS was 108,064 adults aged ≥18 years for whom information on the outcome variables and the covariates was available.27
2.3. Measurement of Geographic Area and Covariates
The independent variable of interest was the respondent's state or Metropolitan Statistical Area (MSA) of residence at the time of the survey.27 Data were available for all 50 states and DC and the 15 largest MSAs in the US, as shown in Tables 1-2 and Figures 1-2.
| Unadjusted | Unadj. Odds Ratio and | Adjusted Odds Ratio and | Adjusted | |||||||
|---|---|---|---|---|---|---|---|---|---|---|
| Prevalence | 95% Confidence Interval | 95% Confidence Interval | Prevalence | |||||||
| % | SE | OR | Lower | Upper | AOR | Lower | Upper | % | SE | |
| United States | 32.20 | 0.29 | ||||||||
| Alaska | 34.73 | 2.28 | 1.69 | 1.15 | 2.48 | 1.27 | 0.85 | 1.92 | 34.73 | 2.27 |
| Alabama | 39.15 | 1.82 | 2.04 | 1.42 | 2.93 | 1.48 | 1.01 | 2.18 | 38.01 | 1.78 |
| Arkansas | 37.91 | 1.78 | 1.94 | 1.35 | 2.78 | 1.38 | 0.94 | 2.03 | 36.48 | 1.70 |
| Arizona | 35.42 | 1.61 | 1.74 | 1.22 | 2.48 | 1.21 | 0.83 | 1.77 | 33.61 | 1.55 |
| California | 29.42 | 1.11 | 1.32 | 0.94 | 1.87 | 0.95 | 0.66 | 1.38 | 28.79 | 1.05 |
| Colorado | 35.09 | 1.54 | 1.71 | 1.20 | 2.44 | 1.36 | 0.93 | 1.99 | 36.19 | 1.51 |
| Connecticut | 27.85 | 1.51 | 1.22 | 0.85 | 1.75 | 0.99 | 0.67 | 1.45 | 29.46 | 1.56 |
| District of Columbia | 23.97 | 3.05 | 1.00 | Reference | 1.00 | Reference | 29.73 | 3.57 | ||
| Delaware | 25.68 | 1.88 | 1.10 | 0.75 | 1.60 | 0.86 | 0.58 | 1.29 | 26.90 | 1.86 |
| Florida | 31.97 | 1.37 | 1.49 | 1.05 | 2.12 | 1.07 | 0.73 | 1.55 | 31.02 | 1.30 |
| Georgia | 34.10 | 1.58 | 1.64 | 1.15 | 2.34 | 1.27 | 0.87 | 1.86 | 34.68 | 1.55 |
| Hawaii | 25.43 | 2.16 | 1.08 | 0.73 | 1.61 | 0.85 | 0.55 | 1.29 | 26.52 | 2.24 |
| Iowa | 31.99 | 1.59 | 1.49 | 1.04 | 2.13 | 1.13 | 0.77 | 1.66 | 32.25 | 1.56 |
| Idaho | 36.65 | 1.67 | 1.83 | 1.28 | 2.62 | 1.34 | 0.91 | 1.96 | 35.83 | 1.60 |
| Illinois | 32.73 | 1.46 | 1.54 | 1.08 | 2.20 | 1.22 | 0.84 | 1.78 | 33.81 | 1.45 |
| Indiana | 36.15 | 1.51 | 1.80 | 1.26 | 2.55 | 1.35 | 0.92 | 1.96 | 35.93 | 1.46 |
| Kansas | 32.61 | 1.44 | 1.53 | 1.08 | 2.18 | 1.16 | 0.79 | 1.69 | 32.74 | 1.43 |
| Kentucky | 35.02 | 1.85 | 1.71 | 1.19 | 2.46 | 1.23 | 0.83 | 1.81 | 33.93 | 1.77 |
| Louisiana | 36.31 | 1.80 | 1.81 | 1.26 | 2.60 | 1.32 | 0.90 | 1.94 | 35.47 | 1.75 |
| Massachusetts | 26.68 | 1.24 | 1.15 | 0.81 | 1.64 | 0.94 | 0.64 | 1.36 | 28.47 | 1.27 |
| Maryland | 28.51 | 1.53 | 1.26 | 0.88 | 1.81 | 1.06 | 0.72 | 1.55 | 30.86 | 1.58 |
| Maine | 27.20 | 2.11 | 1.19 | 0.80 | 1.75 | 0.89 | 0.59 | 1.34 | 27.41 | 2.08 |
| Michigan | 31.18 | 1.32 | 1.44 | 1.01 | 2.04 | 1.12 | 0.77 | 1.63 | 32.09 | 1.32 |
| Minnesota | 30.25 | 1.40 | 1.38 | 0.97 | 1.96 | 1.11 | 0.76 | 1.62 | 31.88 | 1.42 |
| Missouri | 35.72 | 1.60 | 1.76 | 1.24 | 2.51 | 1.34 | 0.92 | 1.96 | 35.83 | 1.56 |
| Mississippi | 38.23 | 1.98 | 1.96 | 1.36 | 2.83 | 1.39 | 0.94 | 2.06 | 36.69 | 1.89 |
| Montana | 33.79 | 2.13 | 1.62 | 1.11 | 2.36 | 1.19 | 0.80 | 1.78 | 33.35 | 2.00 |
| North Carolina | 33.51 | 1.75 | 1.60 | 1.11 | 2.30 | 1.19 | 0.81 | 1.75 | 33.29 | 1.73 |
| North Dakota | 36.27 | 2.01 | 1.81 | 1.25 | 2.61 | 1.38 | 0.93 | 2.04 | 36.39 | 1.96 |
| Nebraska | 34.32 | 1.52 | 1.66 | 1.16 | 2.36 | 1.25 | 0.85 | 1.83 | 34.31 | 1.52 |
| New Hampshire | 28.70 | 1.73 | 1.28 | 0.88 | 1.84 | 0.99 | 0.67 | 1.47 | 29.57 | 1.71 |
| New Jersey | 26.92 | 1.52 | 1.17 | 0.81 | 1.68 | 0.93 | 0.63 | 1.37 | 28.30 | 1.57 |
| New Mexico | 38.54 | 1.85 | 1.99 | 1.38 | 2.86 | 1.29 | 0.88 | 1.91 | 35.06 | 1.76 |
| Nevada | 34.36 | 1.78 | 1.66 | 1.15 | 2.39 | 1.14 | 0.78 | 1.68 | 32.43 | 1.67 |
| New York | 31.16 | 1.59 | 1.44 | 1.00 | 2.06 | 1.11 | 0.76 | 1.63 | 31.87 | 1.60 |
| Ohio | 32.76 | 1.72 | 1.55 | 1.08 | 2.22 | 1.17 | 0.80 | 1.72 | 32.92 | 1.65 |
| Unadjusted | Unadj. Odds Ratio and | Adjusted Odds Ratio and | Adjusted | |||||||
| Prevalence | 95% Confidence Interval | 95% Confidence Interval | Prevalence | |||||||
| % | SE | OR | Lower | Upper | AOR | Lower | Upper | % | SE | |
| Oklahoma | 38.56 | 1.57 | 1.99 | 1.40 | 2.83 | 1.40 | 0.96 | 2.05 | 36.8l | 1.53 |
| Oregon | 32.21 | 1.49 | 1.51 | 1.06 | 2.15 | 1.10 | 0.75 | l.60 | 3l.58 | 1.50 |
| Pennsylvania | 30.34 | 1.47 | 1.38 | 0.97 | 1.97 | 1.06 | 0.73 | l.55 | 30.90 | 1.43 |
| Rhode Island | 30.98 | 2.19 | 1.42 | 0.97 | 2.09 | 1.02 | 0.68 | l.54 | 30.22 | 2.10 |
| South Carolina | 35.22 | 1.64 | 1.72 | 1.21 | 2.46 | 1.30 | 0.89 | 1.90 | 35.14 | l.56 |
| South Dakota | 35.15 | 2.12 | 1.72 | 1.18 | 2.50 | 1.31 | 0.88 | 1.94 | 35.28 | 2.0l |
| Tennessee | 36.38 | 1.56 | 1.81 | 1.27 | 2.58 | 1.39 | 0.95 | 2.02 | 36.58 | l.52 |
| Texas | 33.22 | 1.26 | 1.58 | 1.12 | 2.23 | 1.11 | 0.77 | 1.61 | 3l.83 | 1.19 |
| Utah | 35.77 | 1.44 | 1.77 | 1.24 | 2.51 | 1.35 | 0.93 | 1.96 | 35.93 | 1.36 |
| Virginia | 28.87 | 1.46 | 1.29 | 0.90 | 1.84 | 1.05 | 0.72 | 1.54 | 30.71 | 1.51 |
| Vermont | 26.26 | 2.20 | 1.13 | 0.76 | 1.68 | 0.87 | 0.57 | 1.31 | 26.96 | 2.14 |
| Washington | 28.57 | 1.19 | 1.27 | 0.90 | 1.80 | 0.97 | 0.67 | 1.4l | 29.19 | 1.16 |
| Wisconsin | 28.96 | 1.57 | 1.29 | 0.90 | 1.86 | 0.99 | 0.67 | 1.46 | 29.57 | 1.64 |
| West Virginia | 43.55 | 2.22 | 2.45 | 1.69 | 3.55 | 1.78 | 1.20 | 2.65 | 42.20 | 2.14 |
| Wyoming | 39.94 | 2.11 | 2.11 | 1.46 | 3.06 | 1.52 | 1.02 | 2.26 | 38.62 | 2.03 |
| Health disparity indices | ||||||||||
| CV | 13.07 | 10.36 | ||||||||
| RMSD | 9.82 | 7.22 | ||||||||
| CV(RMSD) | 40.99 | 27.24 | ||||||||
SE= standard error; OR=odds ratio; AOR=adjusted odds ratio; RMSD=root-mean-square-deviation; CV=coefficient of variation. Chi-square statistics for testing the overall association between state and prevalence of Long COVID were statistically significant at p<0.01. Odds ratios (ORs), estimated by logistic model, were unadjusted for the effects of other covariates. Adjusted odds ratios (AORs) were estimated by logistic regression model that controlled for age, race/ethnicity, gender; LGBT status, marital status, region of residence, education, household income, housing tenure, and health insurance status.
| Unadjusteds | Unadj. Odds Ratio and | Adjusted Odds Ratio and | Adjusted | |||||||
|---|---|---|---|---|---|---|---|---|---|---|
| Prevalence | 95% Confidence Interval | 95% Confidence Interval | Prevalence | |||||||
| % | SE | OR | Lower | Upper | AOR | Lower | Upper | % | SE | |
| United States | 13.76 | 0.22 | ||||||||
| Alaska | 11.25 | 1.23 | 1.68 | 1.14 | 2.47 | 1.48 | 1.00 | 2.19 | 11.58 | 1.25 |
| Alabama | 19.35 | 1.62 | 3.18 | 2.21 | 4.57 | 2.52 | 1.74 | 3.65 | 18.04 | 1.50 |
| Arkansas | 15.87 | 1.40 | 2.50 | 1.74 | 3.60 | 2.03 | 1.41 | 2.94 | 15.17 | 1.32 |
| Arizona | 14.63 | 1.19 | 2.27 | 1.59 | 3.24 | 1.83 | 1.27 | 2.62 | 13.89 | 1.12 |
| California | 12.41 | 0.79 | 1.88 | 1.35 | 2.62 | 1.50 | 1.07 | 2.11 | 11.73 | 0.76 |
| Colorado | 14.18 | 1.20 | 2.19 | 1.53 | 3.13 | 2.07 | 1.44 | 2.98 | 15.42 | 1.25 |
| Connecticut | 13.67 | 1.20 | 2.10 | 1.46 | 3.01 | 1.96 | 1.35 | 2.84 | 14.73 | 1.30 |
| District of Columbia | 9.81 | 2.24 | 1.44 | 0.81 | 2.58 | 1.44 | 0.78 | 2.63 | 11.31 | 2.60 |
| Delaware | 12.33 | 1.49 | 1.86 | 1.24 | 2.79 | 1.63 | 1.08 | 2.47 | 12.63 | 1.53 |
| Florida | 12.68 | 0.91 | 1.92 | 1.37 | 2.71 | 1.54 | 1.08 | 2.18 | 12.00 | 0.88 |
| Georgia | 15.33 | 1.20 | 2.40 | 1.69 | 3.41 | 1.98 | 1.38 | 2.84 | 14.85 | 1.17 |
| Hawaii | 14.22 | 2.03 | 2.20 | 1.41 | 3.43 | 1.82 | 1.16 | 2.87 | 13.87 | 1.95 |
| Iowa | 13.96 | 1.29 | 2.15 | 1.49 | 3.11 | 2.02 | 1.39 | 2.94 | 15.12 | 1.36 |
| Idaho | 14.13 | 1.12 | 2.18 | 1.53 | 3.10 | 1.97 | 1.38 | 2.82 | 14.78 | 1.16 |
| Illinois | 12.42 | 1.05 | 1.88 | 1.32 | 2.68 | 1.68 | 1.17 | 2.40 | 12.91 | 1.07 |
| Indiana | 14.32 | 1.14 | 2.21 | 1.56 | 3.15 | 1.98 | 1.38 | 2.83 | 14.83 | 1.17 |
| Kansas | 11.37 | 0.92 | 1.70 | 1.20 | 2.41 | 1.57 | 1.10 | 2.23 | 12.19 | 0.96 |
| Kentucky | 16.38 | 1.61 | 2.60 | 1.78 | 3.79 | 2.27 | 1.54 | 3.35 | 16.61 | 1.63 |
| Louisiana | 15.70 | 1.40 | 2.47 | 1.71 | 3.56 | 1.91 | 1.31 | 2.79 | 14.43 | 1.34 |
| Massachusetts | 9.98 | 0.99 | 1.47 | 1.01 | 2.13 | 1.39 | 0.96 | 2.03 | 11.03 | 1.07 |
| Maryland | 12.72 | 1.07 | 1.93 | 1.35 | 2.76 | 1.76 | 1.22 | 2.52 | 13.43 | 1.12 |
| Maine | 10.94 | 1.46 | 1.63 | 1.07 | 2.48 | 1.52 | 0.99 | 2.34 | 11.91 | 1.57 |
| Michigan | 12.56 | 0.95 | 1.90 | 1.35 | 2.69 | 1.74 | 1.23 | 2.48 | 13.34 | 1.00 |
| Minnesota | 11.84 | 1.01 | 1.78 | 1.25 | 2.54 | 1.77 | 1.23 | 2.55 | 13.54 | 1.16 |
| Missouri | 13.38 | 1.20 | 2.05 | 1.42 | 2.94 | 1.84 | 1.27 | 2.66 | 13.97 | 1.22 |
| Mississippi | 19.89 | 1.79 | 3.29 | 2.27 | 4.78 | 2.49 | 1.71 | 3.64 | 17.88 | 1.61 |
| Montana | 15.14 | 1.70 | 2.36 | 1.59 | 3.52 | 2.14 | 1.44 | 3.18 | 15.81 | 1.66 |
| North Carolina | 13.88 | 1.18 | 2.14 | 1.49 | 3.05 | 1.79 | 1.24 | 2.59 | 13.66 | 1.18 |
| North Dakota | 15.71 | 1.64 | 2.47 | 1.68 | 3.64 | 2.31 | 1.57 | 3.42 | 16.86 | 1.68 |
| Nebraska | 13.05 | 1.12 | 1.99 | 1.39 | 2.84 | 1.84 | 1.28 | 2.65 | 13.99 | 1.16 |
| New Hampshire | 11.21 | 1.13 | 1.67 | 1.15 | 2.43 | 1.61 | 1.10 | 2.35 | 12.46 | 1.22 |
| New Jersey | 13.22 | 1.21 | 2.02 | 1.40 | 2.91 | 1.80 | 1.24 | 2.61 | 13.69 | 1.24 |
| New Mexico | 16.21 | 1.34 | 2.56 | 1.79 | 3.67 | 1.91 | 1.32 | 2.75 | 14.39 | 1.21 |
| Nevada | 15.36 | 1.38 | 2.41 | 1.67 | 3.47 | 1.89 | 1.30 | 2.74 | 14.28 | 1.28 |
| New York | 13.77 | 1.31 | 2.12 | 1.46 | 3.07 | 1.80 | 1.23 | 2.64 | 13.74 | 1.32 |
| Ohio | 14.10 | 1.34 | 2.18 | 1.50 | 3.15 | 1.93 | 1.32 | 2.81 | 14.54 | 1.36 |
| Unadjusted | Unadj. Odds Ratio and | Adjusted Odds Ratio and | Adjusted | |||||||
| Prevalence | 95% Confidence Interval | 95% Confidence Interval | Prevalence | |||||||
| % | SE | OR | Lower | Upper | AOR | Lower | Upper | % | SE | |
| Oklahoma | 14.84 | 1.17 | 2.31 | 1.62 | 3.28 | 1.93 | 1.35 | 2.76 | 14.54 | 1.13 |
| Oregon | 12.37 | 0.98 | 1.87 | 1.32 | 2.65 | 1.68 | 1.18 | 2.40 | 12.96 | 1.00 |
| Pennsylvania | 13.80 | 1.26 | 2.12 | 1.47 | 3.06 | 1.92 | 1.33 | 2.78 | 14.47 | 1.27 |
| Rhode Island | 12.39 | 1.90 | 1.87 | 1.19 | 2.96 | 1.64 | 1.02 | 2.64 | 12.68 | 1.99 |
| South Carolina | 14.86 | 1.21 | 2.31 | 1.62 | 3.30 | 1.88 | 1.31 | 2.70 | 14.22 | 1.16 |
| South Dakota | 14.98 | 1.92 | 2.34 | 1.53 | 3.56 | 2.20 | 1.43 | 3.38 | 16.18 | 2.03 |
| Tennessee | 14.47 | 1.27 | 2.24 | 1.56 | 3.22 | 1.94 | 1.35 | 2.78 | 14.58 | 1.21 |
| Texas | 16.46 | 1.02 | 2.61 | 1.87 | 3.65 | 2.07 | 1.48 | 2.91 | 15.42 | 0.94 |
| Utah | 14.26 | 1.01 | 2.20 | 1.57 | 3.10 | 2.14 | 1.51 | 3.04 | 15.84 | 1.09 |
| Virginia | 14.34 | 1.21 | 2.22 | 1.55 | 3.17 | 2.05 | 1.43 | 2.96 | 15.29 | 1.27 |
| Vermont | 7.01 | 1.00 | 1.00 | Reference | 1.00 | Reference | 8.22 | 1.16 | ||
| Washington | 11.80 | 0.84 | 1.77 | 1.26 | 2.49 | 1.63 | 1.15 | 2.30 | 12.61 | 0.89 |
| Wisconsin | 10.38 | 0.96 | 1.53 | 1.07 | 2.21 | 1.42 | 0.98 | 2.05 | 11.19 | 1.03 |
| West Virginia | 16.16 | 1.68 | 2.55 | 1.74 | 3.76 | 2.16 | 1.46 | 3.21 | 15.96 | 1.64 |
| Wyoming | 14.85 | 1.46 | 2.31 | 1.59 | 3.37 | 2.04 | 1.39 | 2.99 | 15.22 | 1.47 |
| Health disparity indices | ||||||||||
| CV | 16.50 | 13.06 | ||||||||
| RMSD | 7.08 | 6.06 | ||||||||
| CV(RMSD) | 100.98 | 73.68 | ||||||||
SE= standard error; OR=odds ratio; AOR=adjusted odds ratio; RMSD=root-mean-square-deviation; CV=coefficient of variation. Chi-square statistics for testing the overall association between state and prevalence of severe COVID symptoms were statistically significant at p<0.01. Odds ratios (ORs), estimated by logistic model, were unadjusted for the effects of other covariates. Adjusted odds ratios (AORs) were estimated by logistic regression model that controlled for age, race/ethnicity, gender; LGBT status, marital status, region of residence, education, household incousing tenure, and health insurance status.

- Prevalence1 and Adjusted2 Odds Ratios for Long COVID among Adults Aged ≥18 Years in the 15 Largest Metropolitan Statistical Areas (MSAs), United States, June-October 2022 (N=33,253)
-
1Long COVID prevalence rates for all MSAs except Boston, Philadelphia, Seattle, and DC MSAs were significantly higher than the rate for the San Francisco MSA at p<0.05. 2Adjusted by logistic regression for age, race/ethnicity, gender, LGBT status, marital status, education, household income, housing tenure, and insurance status. The adjusted odds ratio for Atlanta, Chicago, Detroit, Phoenix, and Riverside MSAs were significantly higher than the San Francisco MSA at p<0.05.
- Source: Data derived from June-October 2022 Household Pulse Survey

- Prevalence1 and Adjusted2 Odds Ratios for Severe COVID Symptoms among Adults Aged ≥18 Years in the 15 Largest Metropolitan Statistical Areas (MSAs), United States, June-October 2022 (N=33,202)
- Prevalence rates for severe COVID symptoms for all MSAs except Boston, Philadelphia, Seattle, and DC MSAs were significantly higher than the rate for the San Francisco MSA at p<0.05. Adjusted by logistic regression for age, race/ethnicity, gender, LGBT status, marital status, education, household income, housing tenure, and insurance status. Adjusted odds ratios for Atlanta, Chicago, Detroit, Phoenix, and Riverside MSA were significantly higher than the San Francisco MSA at p<0.05.
- Source: Data derived from June-October 2022 Household Pulse Survey
Based on previous research on COVID-related outcomes and the social determinants of health framework, we selected the following covariates for the two outcome variables: age (18-24 years, 2534, 35-44, 45-54, 55-64, 65-74, ≥75), race/ethnicity (non-Hispanic White, non-Hispanic Black/African American, Asian, Hispanic, other and multiple races), gender (male, female), lesbian, gay, bisexual, and transgender (LGBT) status (lesbian or gay, bisexual, transgender, straight/heterosexual, other), marital status (married, widowed, divorce/separated, single), region of residence (Northeast, South, Midwest, West), educational attainment (less than high school, high school, some college, college degree, graduate degree or higher), annual household income (<$25,000; 25,000-34,999; 35,000-49,999; 50,000-74,999; 75,000-99,999; 100,000-149,999; 150,000-199,999; ≥200,000; unknown), housing tenure (homeowner, renter), and health insurance status (insured, not insured).6,9,12,22,27,30
2.4. Statistical Methods
Given the binary outcome variables, multivariable logistic regression was used to model disparities in COVID-related outcomes by geographic area after controlling for socioeconomic, demographic, and health care characteristics. The Chi-square statistic tested the overall association between each covariate and Long COVID or severe COVID symptoms prevalence, while the two-sample t-test assessed differences in prevalence between any two geographic areas. To account for the complex sample design of the HPS, SUDAAN software was used to conduct all statistical analyses, including the logistic modeling procedure RLOGIST.31 Adjusted prevalence estimates for the two outcome variables were derived by the logistic model at the mean values of the covariates.
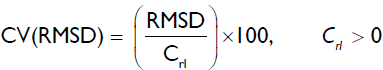
We used two health disparity indices,the coefficient of variation and the root-mean-square-deviation (RMSD) to summarize geographic disparities in Long COVID and severe COVID symptoms among 50 states and DC or among 15 metropolitan areas.32-34 We used root-mean-square-deviation (RMSD) as a summary measure of geographic disparities among 50 states and DC or among 15 metropolitan areas.32,33 The RMSD, developed by Singh and colleagues, is similar to the square root of the variance, except that the average-squared-deviations are calculated using a “standard” estimate other than the sample mean. The RMSD is given by the formula:

where Cri is the prevalence of Long COVID or severe COVID symptoms for the ith state (i=1,2 51) or MSA (i=1,2 15), Crl is the corresponding statistic for the “standard” state or metropolitan area with the lowest prevalence (i.e., DC or San-Francisco for Long COVID), and 1 is the number of states (51) or metropolitan areas (15) being compared. While RMSD is a measure of absolute health disparity, the coefficient of variation (CV) of the where Cri is the prevalence of Long COVID or severe COVID symptoms for the ith state (i=1,2 51) or MSA (i=1,2 15), Crl is the corresponding statistic for the “standard” state or metropolitan area with the lowest prevalence (i.e., DC or San-Francisco for Long COVID), and 1 is the number of states (51) or metropolitan areas (15) being compared.
While RMSD is a measure of absolute health disparity, the coefficient of variation (CV) of the RMSD provides an estimate of relative disparity and is given by
3. Results
3.1. State and Metropolitan Area Disparities in Long COVID Prevalence
During June-October 2022, an estimated 35.4 million or 32.2% of US adults aged ≥18 years with COVID-19 infection reported experiencing Long COVID symptoms (Table 1). This amounts to 14.4% (or 1 in 7) of all US adults developing Long COVID at some point (data not shown). Among those who reported experiencing Long COVID, 18.2 million or 51.6% reported having Long COVID symptoms currently (data not shown).
The prevalence of Long COVID ranged from a low of 24.0% in DC, 25.4% in Hawaii to a high of 39.2% in Alabama, 39.9% in Wyoming, and 43.6% in West Virginia. Adjusted for individual-level covariates, adults with COVID-19 diagnosis in Alabama, Wyoming, and West Virginia had 48-178% higher adjusted odds of developing Long COVID than their counterparts in DC (Table 1). State maps on unadjusted and adjusted prevalence show higher rates of Long COVID in the Southeast, Southwest, and Northern Plains states and lower rates of Long COVID in states along the East and West coasts of the United States (Figure 3).

- (a-d) State Differences in the Prevalence of Long COVID and Severe COVID Symptoms (%) among Adults Aged ≥18 Years During the COVID-19 Pandemic, United States, June - October 2022
- Adjusted prevalence estimates for Long COVID and severe COVID symptoms were derived by logistic regression models that controlled for age, race/ethnicity, gender, LGBT status, marital status, education, household income, housing tenure, and health insurance status
Large disparities in Long COVID prevalence among the 15 largest metropolitan areas ranged from 21.9% in San Francisco to 38.0% in Riverside, California (Figure 1).Adults with COVID-19 diagnosis in Atlanta, Phoenix, Chicago, Riverside, and Detroit metropolitan areas had 43-69% higher adjusted odds of developing Long COVID than their counterparts in the San Francisco Metropolitan Area (Figure 1).
Health disparity indices in Table 1 summarize geographic disparities in Long COVID and provide an assessment of the extent to which the observed geographic disparities can be attributed to state or metropolitan area differences in individual-level socioeconomic, demographic, and health insurance characteristics. The relative summary index of state disparity, CV(RMSD), decreased from 41.0% for the crude prevalence to 27.2% for the adjusted prevalence, suggesting that the adjustment for the individual-level sociodemographic and healthcare factors accounted for 34% of the state disparity in Long COVID. Adjustment for sociodemographic factors accounted for 45% of the metropolitanarea disparity in Long COVID (data not shown). The simple index of CV indicates a 21% reduction in state disparity (13.1% vs.10.4%) and a 29% metropolitan-area disparity in Long COVID after covariate adjustment.
3.2. State and Metropolitan Area Disparities in COVID-19 Disease Severity
An estimated 15.2 million (13.8%) US adults aged ≥18 with COVID infection reported experiencing severe COVID symptoms from June to October 2022 (Table 2). The prevalence of severe COVID symptoms ranged from 19.9% in Mississippi and 19.4% in Alabama to 9.8% in DC and 7.0% in Vermont. Adults with COVID-19 diagnosis in Alabama, Arkansas, Colorado, Iowa, Kentucky, Mississippi, Montana, North Dakota, South Dakota, Texas, Utah, Virginia, Wyoming, and West Virginia had 2.0-2.5 times higher adjusted odds of experiencing severe COVID symptoms than their counterparts in Vermont. State maps on unadjusted and adjusted prevalence show higher rates of severe COVID symptoms in the Southeast, Southwest, and Northern Plains states and lower rates of severe COVID symptoms in states along the East and West coasts of the US (Figure 3). The correlation coefficient between state rates of Long COVID and severe COVID symptoms was 0.71.
Disparities in the prevalence of severe COVID symptoms among the 15 metropolitan areas were pronounced, with the prevalence ranging from 8.9% in San Francisco to 17.5% in Riverside, California (Figure 2). Adults with COVID-19 diagnosis in New York, Detroit, Phoenix, Atlanta, Houston, Riverside, and Dallas metropolitan areas had 5077% higher adjusted odds of experiencing severe COVID symptoms than their counterparts in the San Francisco Metropolitan Area (Figure 2).
State disparities in severe COVID symptoms, as measured by CV(RMSD), were reduced from 101.0% for the unadjusted prevalence to 73.7% for the adjusted prevalence, indicating a 27% reduction in state disparity after the adjustment for the individual-level covariates (Table 2). Individual- level sociodemographic factors explained 13% of the metropolitan-area disparity in severe COVID symptoms (data not shown).
4. Discussion
In this study, using recent national data, we have analyzed state and metropolitan area disparities in the prevalence of Long COVID and disease severity among COVID patients/survivors in the US. We found marked geographic disparities, with COVID survivors in the Southeast, Southwest, and Northern Plains states being at substantially higher risks of developing Long COVID and severe COVID symptoms. This study is the first to document state and metropolitan area disparities in Long COVID and disease severity among COVID survivors during the ongoing pandemic and to explore whether individual-level socioeconomic, demographic, and health insurance factors explain these geographic disparities. Additionally, our study makes a unique contribution to COVID-19 research by identifying specific geographic areas in which American adults face increased risks of post-COVID conditions and severe COVID symptoms and who are, therefore, in need of greater healthcare access and preventive, treatment, and social services.14,15,26 Equitable access to and utilization of healthcare and other services among patients afflicted with Long COVID and related conditions is critical to reducing geographic inequities in COVID-related health outcomes.
Our study findings on geographic disparities in Long COVID and severe COVID symptoms are generally consistent with those that show significant geographic disparities in COVID-19 cases and mortality and mortality from several leading causes of death, chronic health conditions, and behavioral risk factors.9,23,30,35,36 Data from the 2021 Behavioral Risk Factor Surveillance System (BRFSS) show higher rates of fair/poor overall health, chronic conditions such as heart disease, hypertension, diabetes, kidney disease, and COPD, and behavioral risk factors such as smoking, physical inactivity, and obesity in the Southeastern and Southwestern parts of the US.23 Consistent with geographic patterns in Long COVID or disease severity, Southeastern and Southwestern states have higher rates of COVID-19 diagnoses and mortality and lower rates in states along the East and West coasts of the US.9,35
4.1. Limitations
This study has some limitations. HPS does not collect information on many factors that could help explain geographic disparities in Long COVID and disease severity among COVID patients/survivors, including social and physical isolation, lack of social support or connectedness, loss of self-identity and sense of control, unhealthy diet, lack of physical inactivity, smoking, alcohol and other substance use, lack of or limited access to care, and comorbidities.22 Although comorbidities such as hypertension, smoking, diabetes, obesity and other pre-existing conditions are important risk factors for COVID-19 infection, Long COVID, and disease severity, they may not fully explain geographic disparities in Long COVID shown here.18,24,37 In fact, Long COVID can develop among people who have had no or mild symptoms, although people with more severe COVID symptoms are at the greatest risk of developing Long COVID and long-term impairments.18,24
Second, data on specific clinically diagnosed COVID symptoms were not available in HPS. Moreover, the self-reported cases of Long COVID are probably underestimated as has been the case with official estimates of COVID-19 infections, hospitalizations, and deaths.38 Many of the COVID patients whose symptoms have persisted for longer than three months since or sometime after the initial COVID-19 diagnosis may not be aware that the painful symptoms or health conditions they currently experience might actually be due to Long COVID. However, self-reported nature of the HPS data on Long COVID symptoms and lack of clinical assessment in some cases might have erroneously been attributed to Long COVID, resulting in an overestimation of the prevalence.39
Third, due to confidentiality concerns, public use HPS files do not provide geographic data below the state level (e.g., county level).12,28,29 Because of significant heterogeneity in socioeconomic, health status, and health care characteristics across US counties, actual geographic disparities in the prevalence of Long COVID and severe COVID symptoms, as captured by state-level differences, are likely underestimated.9,35
Fourth, our study did not analyze geographic patterns in Long COVID and disease severity separately for men and women and by race/ethnicity. We found a 45% higher risk of Long COVID among women than men and 47-75% higher risk of Long COVID among Hispanics, Blacks, and non-Hispanic Whites than Asians (data not shown). Future studies might benefit from examining whether geographic patterns differ by gender and among racial/ethnic minorities.
Fifth, the respondents in HSP are more likely to be women and non-Hispanic Whites and have higher education, compared with the American Community Survey.40 This might have resulted in an underestimate of the magnitude of disparities in COVID-related outcomes. However, we addressed disproportionate sampling of demographic characteristics by using survey weights, which rakes the demographics of the interviewed persons to education attainment/sex/age distributions and ethnicity/race/sex/age population distributions.29
5. Conclusion and Implications for Translation
Based on our analysis of recent national data on 108,064 COVID survivors aged ≥18 years, we found significant disparities in Long COVID and severe COVID symptoms across state and metropolitan areas in the US, even after accounting for a range of patient-level socioeconomic, demographic, and health care factors. These data should contribute significantly to understanding the underlying social determinants, causes, and epidemiology of disparities in Long COVID and could be immensely useful in developing state- and community-based policies, programs, and strategies for providing health care, treatment, and support services to those afflicted with Long COVID and associated health conditions.
Compliance with Ethical Standards
Conflicts of interest:
The authors declare that they have no conflict of interest.
Financial Disclosure:
None to report.
Ethical approval:
No IRB approval was required for this study, which is based on the secondary analysis of a public-use federal database.
Disclaimer:
The views expressed are the authors’ and not necessarily those of their institutions.
Acknowledgments:
None.
Funding/Support:
None.
References
- Impact of COVID-19 on People’s Livelihoods, Their Health and Our Food Systems. Accessed January 4, 2023. https://www.whoJnt/news/item/13-10-2020-impact-of-covid-19-on-people’s-livelihoods-their-health-and-our-food-systems
- [Google Scholar]
- Coronavirus Disease (COVID-19) Pandemic. Accessed January 11, 2023. https://www.who.int/emergencies/diseases/novel-coronavirus-2019
- [Google Scholar]
- The Impact of the COVID-19 Pandemic on Jobs and Incomes in G20 Economies. G20 Saudi Arabia 2020 Accessed January 4, 2023. https://www.ilo.org/wcmsp5/groups/public/—dgreports/— cabinet/documents/publication/wcms_756331.pdf
- [Google Scholar]
- Provisional life expectancy estimates for January through June, 2020. Vital Statistics Rapid Release. no 10. 2021 2021 February doi: https://dx.doi.org/10.15620/cdc:100392
- [CrossRef] [Google Scholar]
- Growing job-related income losses, increasing social inequalities, and physical and mental health impact during the COVID-19 pandemic, United States, April-December 2020. int J Transl Med Res Public Health. 2021;5(2):76-89. doi: 10.21106/ijtmrph.347
- [CrossRef] [Google Scholar]
- Marked inequalities in COVID-19 vaccination by racial/ethnic, socioeconomic, geographic, and health characteristics, United States, January 6 - February 15, 2021. int J Transl Med Res Public Health. 2021;5(2):103-112. doi: 10.21106/ijtmrph.357
- [CrossRef] [Google Scholar]
- Years of life lost to COVID-19 in 81 countries. Sci Rep. 2021;11:3504. https://doi.org/10.1038/s41598-021-83040-3
- [CrossRef] [PubMed] [Google Scholar]
- Coronavirus Resource Center. United States COVID-19 Overview Accessed January 11, 2023. https://coronavirus.jhu.edu/ region/united-states
- [Google Scholar]
- Marked disparities in COVID-19 prevalence by racial/ethnic, socioeconomic, geographic, and health care characteristics, United States, January - April, 2021. Int J Transl Med Res Public Health. 2021;5(2):135-148. doi: 10.21106/ijtmrph.345
- [CrossRef] [Google Scholar]
- Weighing the Cost of the Pandemic - Knowing what we know now, how much damage did COVID-19 cause in the United States? Johns Hopkins Bloomberg School of Public Health, Center for Health Security Published April 21, 2022. Accessed January 10, 2023. https://www. centerforhealthsecurity.org/our-work/publications/weighing-the-cost-of-the-pandemic#:~:text=Summers%20published%20a%20brief%20article,and%20used%20in%20 policy%20discussions
- [Google Scholar]
- COVID-19: Data and Surveillance. Published March 7, 2022. Accessed January 10, 2023. https://www.cdc.gov/coronavirus/2019-ncov/cases-updates/index.html
- [Google Scholar]
- Week 50 Household Pulse Survey: October 5-17, 2022. Published October 26, 2022. Accessed January 4, 2023. https://www.census.gov/data/tables/2022/demo/hhp/hhp50.html
- [Google Scholar]
- Addressing the long-term effects of COVID-19. JAMA. 2022;328(9):823-824. doi: 10.1001/jama.2022.14089
- [CrossRef] [PubMed] [Google Scholar]
- The US now has a research plan for Long COVID - is it enough? JAMA. 2022;328(9):812-814. doi: 10.1001/ jama.2022.14536
- [CrossRef] [PubMed] [Google Scholar]
- National Research Action Plan on Long COViD. 2022 Accessed January 4, 2023. https://www.covid.gov/assets/files/National-Research-Action- Plan-on-Long-COVID-08012022.pdf
- [Google Scholar]
- Post COViD Conditions (Long COViD) Accessed January 4, 2023. https://medlineplus.gov/postcovidconditionslongcovid.html#:~:text=General%20symptoms%2C%20such%20as%20fatigue,)%2C%20headaches%2C%20and%20sleep%20problems
- [Google Scholar]
- Symptoms and risk factors for long covid in non- hospitalized adults. Nat Med. 2022;28(8):1706-1714. doi: 10.1038/s41591-022-01909-w
- [CrossRef] [PubMed] [Google Scholar]
- Long COViD: Long-Term Effects of COViD-19. Published June 14, 2022. Accessed January 4, 2023. https://www.hopkinsmedicine.org/health/conditions-and-diseases/coronavirus/covid-long-haulers- long-term-effects-of-covid I9#:~:text=People%20with%20long%20C0VID%2C%20or,them%20return%20to%20 previous%20life
- [Google Scholar]
- Identification of deaths with post-acute sequelae of COVID-19 from death certificate literal text: United States, January 1, 2020 - June30, 2022. Vital Statistics Rapid Release. no 25 2022 Published December 2022. Accessed January 4, 2023. https://dx.doi.org/10.15620/cdc:121968
- [CrossRef] [Google Scholar]
- New Data Show Long Covid is Keeping As Many As 4 Million People Out of Work. Brookings Institution; Published August 24, 2022. Accessed January 4, 2023. https://www.brookings.edu/research/new-data-shows- long-covid-is-keeping-as-many-as-4-million-people- out-of-work/#:~:text=to%20a%20friend-,New%20data%20shows%20long%20Covid%20is%20keeping%20as%20many, million%20people%20out%20of%20 work&text=Since%20the%20depths%20of%20the,missing%20workers%20has%20dominated%20 headlines
- [Google Scholar]
- The costs of Long COVID. JAMA Health Forum. 2022;3(5):e221809. doi:10.1001/jamahealthforum.2022.1809
- [CrossRef] [PubMed] [Google Scholar]
- Increasing trends in physical and mental health problems among US workers in different job sectors during the COVID-19 pandemic. int J Transl Med Res Public Health. 2021;5(2):90-102. doi: 10.21106/ ijtmrph.351
- [CrossRef] [Google Scholar]
- Behavioral Risk Factor Surveillance System (BRFSS) Prevalence & Trends Data. Accessed January 10, 2023. https://www.cdc.gov/ brfss/brfssprevalence/index.html
- [Google Scholar]
- Long Covid And its Unequal Burden. Forbes; Published July 12, 2022 Accessed January 4, 2023. https:// www.forbes.com/sites/williamhaseltine/2022/07/12/long- covid-and-its-unequal-burden/?sh=112e70962102
- [Google Scholar]
- Monthly trends in self-reported health status and depression by race/ethnicity and socioeconomic status during the COVID-19 Pandemic, United States, April 2020 - May 2021. Ann Epidemiol. 2021;63:52-62. doi: 10.1016/j.annepidem.2021.07.014
- [CrossRef] [PubMed] [Google Scholar]
- Services and Supports for Longer-Term Impacts of COVID-19. 2022 Accessed January 4, 2023. https://www.covid.gov/assets/files/Services-and-Supports-for-Longer-Term-Impacts-of- COVID-19-08012022.pdf
- [Google Scholar]
- Household Pulse Survey Data Dictionary for SAS - Phase 3.5 and 3.6, Weeks 46 to 50, September-November 2022. Accessed January 4, 2023. https://www. census.gov/programs-surveys/household-pulse-survey/ datasets.html
- [Google Scholar]
- Technical Documentation: Source of the Data and Accuracy of the Estimates for the Household Pulse Survey - Phase 3.6. 2022 Accessed January 4, 2023. https:// www2.census.gov/programs-surveys/demo/technical- documentation/hhp/Phase3-6_Source_and_Accuracy_ Week50.pdf
- [Google Scholar]
- Design and Operation of the 2020 Household Pulse Survey. US Census Bureau 2020 Forthcoming. Accessed January 4, 2023. https://www2.census.gov/programs-surveys/demo/technical-documentation/hhp/2020_HPS_Background.pdf
- [Google Scholar]
- Social determinants of health in the United States: addressing major health inequality trends for the nation, 1935-2016. Int J MCH AIDS. 2017;6(2):139-164. doi: 10.21106/ijma.236
- [CrossRef] [PubMed] [Google Scholar]
- Marked ethnic, nativity, and socioeconomic disparities in disability and health insurance among US children and adults. BioMed Res Int. 2013;2013:627412. doi: 10.1155/2013/627412
- [CrossRef] [PubMed] [Google Scholar]
- Marked disparities in pre-pregnancy obesity and overweight prevalence among US women by race/ethnicity, nativity/immigrant status, and sociodemographic characteristics, 2012-2014. J Obes. 2019;2019:2419263. doi: 10.1155/2019/2419263
- [CrossRef] [PubMed] [Google Scholar]
- A multilevel analysis of state and regional disparities in childhood and adolescent obesity in the United States. J Community Health. 2008;33(2):90-102. doi: 10.1007/s10900-007-9071-7
- [CrossRef] [PubMed] [Google Scholar]
- Coronavirus in the U.S.: Latest Map and Case Count. Accessed January 10, 2023. https://www.nytimes. com/interactive/202l/us/covid-cases.html
- [Google Scholar]
- Deaths: Final Data for 2019. Natl Vital Stat Rep. 2021;70(8):1-87. Accessed January 10, 2023. https://www.cdc.gov/nchs/data/nvsr/nvsr70/nvsr70-08-508.pdf
- [CrossRef] [Google Scholar]
- Long covid: hair loss and sexual dysfunction are among wider symptoms. BMJ. 2022;378:o1887. doi: 10.1136/bmj.o1887
- [CrossRef] [PubMed] [Google Scholar]
- Estimated COVID-19 Burden: Estimated COVID-19 Infections, Symptomatic Illnesses, Hospitalizations, and Deaths in the United States. 2022 August Accessed January 10, 2023. https://www.cdc.gov/coronavirus/20l9-ncov/cases- updates/burden.html
- [Google Scholar]
- Association of self-reported COVID-19 infection and SARS-CoV-2 serology test results with persistent physical symptoms among French adults during the COVID-19 pandemic. JAMA Intern Med. 2022;182(1):19-25. doi: 10.1001/ jamainternmed.2021.6454
- [Google Scholar]
- How do state policies shape experiences of household income shocks and mental health during the COVID-19 pandemic? Soc Sci Med. 2021;269:113557. doi: 10.1016/j.socscimed.2020.113557
- [CrossRef] [PubMed] [Google Scholar]