Translate this page into:
Estimating Contributions of Social and Behavioral Factors to Cardiovascular Disease, Cancer, COPD, and Unintentional-Injury Mortality Disparities by Psychological Distress in the United States: A Blinder-Oaxaca Decomposition Analysis of the 1997-2014 NHIS-NDI Record Linkage Study
Abstract
Background:
Previous research has shown a significant association between psychological distress (PD) and cause-specific mortality, but contributions of sociodemographic and behavioral characteristics to mortality differences by PD are not fully explored.
Methods:
The Blinder-Oaxaca decomposition analysis was used to quantify the contributions of individual sociodemographic and behavioral characteristics to the observed cardiovascular disease (CVD), cancer, chronic obstructive pulmonary disease (COPD), and unintentional-injury mortality disparities between United States (US) adults with no PD and those with serious psychological distress (SPD), using the pooled 1997-2014 data from the National Health Interview Survey prospectively linked to the National Death Index (N=263,825).
Results:
Lower levels of education and household income, and higher proportions of current smokers, former drinkers, non-married adults, US-born, and renters contributed to higher mortality for adults with SPD. The relative percentage of mortality explained by sociodemographic and behavioral factors was highest for cancer mortality (71.25%) and lowest for unintentional-injury mortality (20.19%). Enhancing education level among adults with SPD would decrease approximately 30% of cancer or CVD mortality disparity, and around 10% of COPD and unintentional-injury mortality disparities. Half of the cancer mortality disparity (47.4%) could be attributed to a single factor, smoking. Increasing income level will decrease 7 to 13% of the disparity in cause-specific mortality. Higher proportions of renters explained higher CVD and COPD mortality among adults with SPD by 7% and 3%, respectively. Higher proportions of former drinkers explained higher CVD, cancer, and COPD mortality among adults with SPD by 6%, 7%, and 3%, respectively. Younger age, higher proportion of females, and higher BMI among adults with SPD mitigated the mortality disparities.
Conclusion and Implications for Translation:
Improved education and income levels, and reduced smoking among US adults with SPD would eliminate around 90% of the cancer mortality disparity by SPD, and half of the CVD mortality disparity.
Keywords
Psychological Distress
Socioeconomic Status
Health Behaviors
Cause of Death
Cancer
CVD
COPD
Injury
Blinder-Oaxaca Decomposition
Longitudinal

Introduction
In the United States, approximately 4.53% of adults aged 18 years and older had experienced depression and 11.0% of adults regularly had feelings of worry, nervousness, or anxiety during January 2019 to June 2020.1 The prevalence of serious psychological distress (SPD) showed a fairly stable trend with an average 3.6% and 4.0% in 1997 to 3.7% in 2017.2 While spending on psychotropic medications showed a steady reduction with just about 2.7% increase per year during 2012 to 2020,3 the total US mental health spending was estimated to have increased by 65% from 147.4 billion dollars in 2009 to 238.4 billion dollars in 2020.4
In the US, the top 5 leading causes of death were heart disease, cancer, unintentional injury, chronic lower respiratory diseases, and stroke, accounting for 61% of total deaths in 2018.5 Depression, anxiety, and other psychological stressors were associated with the development and progression of these diseases and associated mortality.6-22 Biological pathways through which psychological distress affects CVD,6,7 cancer,23,24 chronic obstructive pulmonary disease (COPD)25 and unintentional injury,26 have been well documented. Psychological conditions could promote heightened inflammation or endothelial dysfunction, contributing to cardiovascular disease (CVD).6,7 Similarly, psychological distress can lead to a favorable environment for tumor initiation, growth, and progression, and spread of cancer cells.23,24
The effect of psychological distress on morbidity and mortality could be explained in conjunction with social and behavioral factors. Socioeconomic status (SES) is directly related to mortality,27,28 or indirectly associated with mortality through psychological distress.29,30 Lower levels of education and income are significantly associated with higher psychological distress.30,31 Since individuals with lower SES are more likely to experience job loss, illness, or disabilities, these stressful experiences disproportionately increase psychological distress or negative emotion among the lower SES group.29,30 Housing tenure gradients in psychological distress are also associated with poorer health outcomes. Compared to homeowners, renters are more likely to experience SPD and have a higher risk of heart disease or COPD.32,33 Individuals who reside in low- SES environments might have fewer financial or community resources to manage stress, resulting in higher morbidity and mortality.30
Psychological distress is associated with unhealthy lifestyle behaviors, such as smoking, poor diet, and a lack of physical activity, which could increase the risk of CVD or other diseases.6,7,25,34 Psychological distress could also interfere with adherence to medical treatment or screening procedures among patients.24,35 A patient's motivation to seek help or to report symptom deterioration, could be reduced by psychological distress, resulting in greater risk for hospitalization among COPD patients.25 Previous studies have found that, compared with those without psychological distress, adults with SPD had 96% higher heart disease mortality risk15 and 61% higher cancer mortality risk36 in sociodemographic- adjusted model, while adults with SPD had 14% higher heart disease mortality risk15 and 33% higher cancer mortality risk36 after additionally controlling for health status and health behaviors. These findings would indicate an interactive effect between psychological distress and health behaviors on CVD and cancer mortality.
Previous research has shown a significant association between mortality and SPD or social or behavioral factors. However, the specific contribution of sociodemographic and behavioral characteristics to excess mortality among adults with SPD has not been directly examined. In this study, we conducted the Blinder-Oaxaca decomposition analysis to quantify the contributions of individual characteristics in explaining the observed mortality differences between adults with no PD and those with SPD for CVD, cancer, COPD, and unintentional-injury mortality.
Methods
Data
The data for this study are derived from the National Health Interview Survey (NHIS) prospectively linked to the National Death Index (NDI).37 As a nationally representative, annual cross-sectional household interview survey, NHIS provides demographic, socioeconomic, and health characteristics of the civilian, non-institutionalized population in the US. The National Center for Health Statistics (NCHS) developed public-use versions of NHIS prospectively linked with death certificate records from the NDI. For this study, we used the latest available 1997-2014 public-use linked mortality file containing 18 years of mortality follow-up data from the date of survey participation through December 31, 2014.38
Sample
The study sample consisted of adults aged 18 and older from the years 1997 to 2014 NHIS sample adult files. Since the main decomposition analysis allows only dichotomous group variable, we restricted the study sample to adults with no PD (K6=0) and adults with SPD (K6=13+) as defined below. The final pooled eligible sample size, after excluding missing values, was 263,825; the listwise deletion accounted for 1.61% of the total sample size of 268,145. For missing values, accounting for more than 1% of the total observations, that is for poverty status (18.74%), body mass index (BMI) (3.54%), and alcohol consumption (1.66%), we created missing categories so as to not lose a substantial number of observations for the analysis.
Outcome Measurement
We analyzed crude death rates for cancer (International Classification of Diseases-10th Revision (ICD-10): C00-C97), CVD (heart disease and stroke combined, 100-109, 111, 113, 120-151, 160-169), COPD (J40-J47), and unintentional injury (V01-X59, Y85-Y86), the top five leading causes of death in the US in 2017.39 All mortality outcomes were dichotomized, with I being dead and zero equaling alive.
Psychological Distress Classification
Psychological distress (PD) was measured by the Kessler 6 (K6) nonspecific distress scale31 of six symptoms. Respondents were asked: “during the past 30 days, how often do you feel 1) so sad that nothing could cheer you up; 2) nervous; 3) restless or fidgety; 4) hopeless; 5) that everything was an effort; 6) worthless.” We created a 5-level categorical variable with scores of 0, 1-2, 3-5, 6-12, and 13-24 from the K6 scale.21 Since Blinder-Oaxaca allows only a dichotomous group comparison, we only used the sample with a score of 0 as a group with no PD and those with a score of 13 or higher as a group with SPD.
Risk Factors
Based on the previous literature, we selected the following risk factors for model estimation: age, sex, race/ethnicity, nativity/immigrant status, education, marital status, poverty status, housing tenure, region of residence, BMI, smoking status, and alcohol consumption.18,21,22,40-43 Age was used as a continuous variable ranging from 18 to ≥85 years. Race/ethnicity was defined by six categories as non-Hispanic White, non-Hispanic Black, Hispanic, non-Hispanic American Indian/Alaska Native, non-Hispanic Asian/Pacific Islander, and non-Hispanic other races. Nativity/immigrant status was categorized as US- born, who was born in one of the 50 states or the District of Columbia, or foreign-born. Educational attainment was defined by four categories as less than high school diploma, high school diploma, some college, and college degree or more. Marital status was categorized as currently married, widowed, divorced/separated, and never married. Poverty status was defined by five categories based on the ratio of family income to the US Census Bureau's federal poverty threshold (<100%; ≥100% & <200%; ≥200% & <400%; ≥400%; missing). Housing tenure was dichotomized, with 1 being renters and zero equaling homeowners. Region of residence was defined by four categories, Northeast, Midwest, South, and West. BMI was defined by four categories, <25, 25-29, 30-39, ≥40, and missing. Smoking status was defined by three categories as never, former, and current smokers. Alcohol consumption was defined by four categories: lifetime abstainer, former drinker, current drinker, and unknown.
Analytic Approach
The Blinder-Oaxaca decomposition analysis was conducted to quantify the contributions of individual characteristics in explaining the observed mortality differences between adults with no PD and those with SPD.44,45
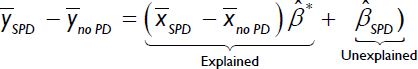
In the equation above, ӯSPD and ӯnoPD represent means of the rates of deaths for adults with SPD and those with no PD, and x̄SPDand x̄no PD are vectors of group-specific means of the individual-level characteristics studied. β̂* is the vector of coefficients from the pooled linear probability models that reflects the average outcome difference associated with each variable. β̂SPD is the adjusted difference in outcomes between adults with no PD and those with SPD that remains unexplained by covariates. The “explained” portion of the decomposition reflects the change in the mean of mortality rates for adults with SPD, compared to those with no PD, due to the differences in the individual-level characteristics. The percentage of the outcome difference explained by each covariate can be calculated by dividing the explained difference by the total difference  of Blinder-Oaxaca decomposition analysis: model 1 included only sociodemographic characteristics; model 2 included both socio-demographic and health behavioral characteristics as contributors, to see confounding effects between sociodemographic and health behavioral characteristics.
Collinearity between model covariates was assessed using variance inflation factors, and all values across models were within an acceptable range (≤1.61). Complex survey design procedures, svy in Stata, were used, to account for clustering, multiple stages of selection, and disproportionate sampling. To correct the bias from the ineligible adults for linkage to the NDI due to insufficient identifying data, we used eligibility-adjusted weights developed by NCHS, instead of the standard sample weight.46 The sample weights were adjusted by dividing by the number of pooling years. All the analyses were conducted by Stata 16 and the Blinder-Oaxaca model was fitted using the Oaxaca procedure.47
Results
Mortality and Individual Characteristics by No Psychological Distress and Serious Psychological Distress
As shown in Table 1, adults with SPD had higher CVD, cancer, COPD, and unintentional injury mortality, compared to those with no PD. Regarding sociodemographic characteristics and health behaviors, adults with SPD were more likely to be female (no PD vs. SPD: 47% vs. 62%, P<0.001), non-Hispanic Blacks (12% vs. 13%), Hispanics (14% vs. 15%), or American Indians/Alaska Natives (0.6% vs. 1.3%), US-born (83% vs. 87%), with less than high school education (13% vs. 29%), never married (22% vs. 25%), below poverty level (8% vs. 28%), renters (28% vs. 47%), less with higher BMI ≥40 (3% vs. 8%), current smokers (17% vs. 42%), and former drinkers (13% vs. 24%).
| No psychological distress(K6=0) | Serious psychological distress(K6=13+) | |||||
|---|---|---|---|---|---|---|
| Sample size | 245,153 | 18,263 | ||||
| Cardiovascular disease(CVD) mortality | 2.09(0.03) | 3.32(0.15)* | ||||
| Cancer Mortality | 2.60(0.04) | 3.60(0.16) | ||||
| COPD Mortality | 0.45(0.02) | 1.37(0.10) | ||||
| Unintentional Injury Mortality | 0.42(0.01) | 0.96(0.08) | ||||
| Age(mean, years) | 46.54(0.08) | 46.22(0.15) | ||||
| Sex | ||||||
| Male | 52.74(0.13) | 38.18(0.47) | ||||
| Female | 47.26(0.13) | 61.82(0.47) | ||||
| Race/ethnicity | ||||||
| non-Hispanic White | 68.42(0.25) | 68.41(0.53) | ||||
| non-Hispanic Black | 12.18(0.19) | 13.12(0.37) | ||||
| Hispanic | 13.86(0.19) | 14.62(0.36) | ||||
| American Indians/Alaska Native | 0.57(0.05) | 1.33(0.13) | ||||
| Asian/Pacific Islander | 4.72(0.09) | 2.20(0.14) | ||||
| non-Hispanic other race | 0.26(0.02) | 0.33(0.05) | ||||
| Nativity/Immigrant status | ||||||
| Foreign-born | 17.38(0.18) | 13.44(0.32) | ||||
| US-born | 82.62(0.18) | 86.56(0.32) | ||||
| Education | ||||||
| Less than high school | 12.96(0.13) | 28.87(0.45) | ||||
| High school | 31.42(0.16) | 35.03(0.47) | ||||
| some college | 28.40(0.14) | 26.99(0.44) | ||||
| college | 27.22(0.21) | 9.12(0.28) | ||||
| Marital status | ||||||
| Currently married | 60.73(0.18) | 41.58(0.54) | ||||
| Widowed | 6.01(0.06) | 8.44(0.23) | ||||
| Divorced/separated | 11.24(0.08) | 25.36(0.41) | ||||
| Never married | 22.02(0.16) | 24.62(0.43) | ||||
| Poverty status(%) | ||||||
| <100 | 8.10(0.11) | 28.13(0.47) | ||||
| ≥100&<200 | 13.23(0.12) | 24.35(0.40) | ||||
| ≥200&<400 | 25.35(0.14) | 21.65(0.39) | ||||
| ≥400 | 34.49(0.22) | 12.91(0.38) | ||||
| missing | 18.84(0.18) | 12.96(0.34) | ||||
| Housing tenure(homeownership) | ||||||
| Renter | 27.87(0.25) | 47.25(0.56) | ||||
| Owner | 72.13(0.25) | 52.75(0.56) | ||||
| Region of residence | ||||||
| Northeast | 18.46(0.20) | 15.93(0.40) | ||||
| Midwest | 22.00(0.27) | 22.72(0.59) | ||||
| South | 39.21(0.33) | 40.75(0.68) | ||||
| West | 20.33(0.25) | 20.60(0.48) | ||||
| Body mass index(BMI) | ||||||
| <25 | 38.48(0.14) | 33.44(0.45) | ||||
| ≥25 & <30 | 35.76(0.12) | 28.29(0.43) | ||||
| ≥30 & <40 | 20.08(0.11) | 27.64(0.41) | ||||
| ≥40 | 2.58(0.04) | 7.79(0.27) | ||||
| missing | 3.10(0.05) | 2.84(0.14) | ||||
| Smoking status | ||||||
| Never smoker | 60.80(0.16) | 37.78(0.49) | ||||
| Former smoker | 21.86(0.12) | 20.01(0.37) | ||||
| Current smoker | 17.34(0.12) | 42.22(0.47) | ||||
| Alcohol consumption | ||||||
| Lifetime abstainer | 25.27(0.19) | 21.56(0.44) | ||||
| Former drinker | 13.35(0.11) | 24.35(0.41) | ||||
| Current drinker | 60.20(0.20) | 53.02(0.52) | ||||
| Unknown | 1.19(0.03) | 1.06(0.11) | ||||
K6=0, the Kessler 6(K6) nonspecific distress scale is zero; K6-13+, K6 scale equals 13 or higher. The data in the parentheses indicate standard errors. *All variables showed that differences between adults with SPD and adults with no PD are statistically significant(p<0.001).
Blinder-Oaxaca Decomposition
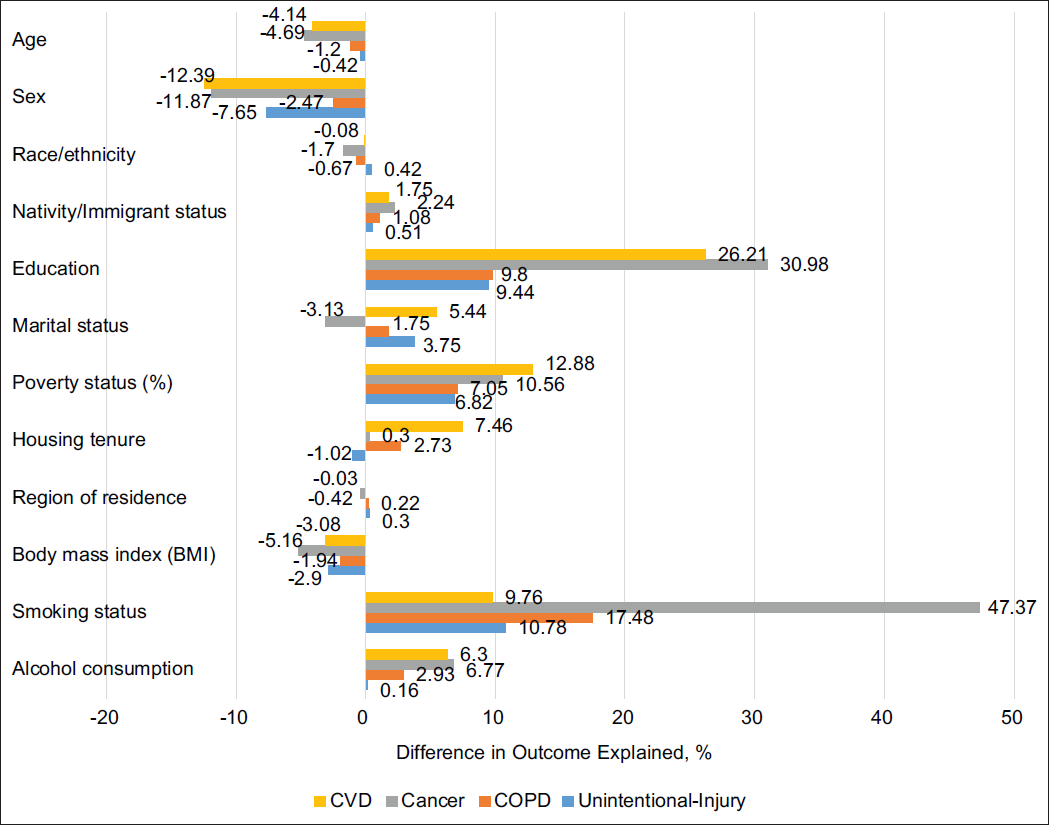
Higher CVD mortality for adults with SPD was explained by the measured sociodemographic factors by 45.75% in Model 1 and by both sociodemographic and behavioral factors by 50.09% in Model 2 (Table 2). In Model 1, the lower educational level for adults with SPD accounted for 29.49% of the total 1.23 percentage point mortality disparity. Lower-income, higher proportions of renters and higher proportions of non-currently- married individuals among adults with SPD also contributed to CVD mortality disparities by 16.39%, 7.63%, and 5.98%, respectively. Higher proportions of females (-10.58%) and younger individuals (-4.17%) favored adults with SPD and decreased CVD mortality disparities between adults with no PD and those with SPD. In Model 2, the contributions of education, poverty status, marital status, and housing tenure slightly decreased, indicating that health behaviors such as smoking and alcohol consumption partly accounted for the impact of sociodemographic factors. Higher proportions of current smokers and former drinkers contributed to CVD mortality disparities by 9.76% and 6.30%, respectively, while higher proportion of BMI among adults with SPD decreased CVD mortality by 3.08% (Table 2, Figure 1). Cancer mortality difference (1.00 percentage point, 95% CI = -1.33, -0.68) between adults with no psychological disparities and those with SPD was explained by 37.46% in Model 1 and 71.25% of the difference was explained by Model 2, in total (Table 3). In Model 2, around half of the cancer mortality disparity (0.48 percentage points, or 47.37%) could be attributed to the higher rate of current smoking among adults with SPD. Lower educational level, lower-income, and higher proportions of former or current drinkers and US- born also contributed to higher cancer mortality for adults with SPD by 30.98%, 10.56%, 6.77%, and 2.24%, respectively (Table 3, Figure 1). However, younger age, higher proportion of females and racial/ethnic minorities, and higher BMI mitigated the cancer mortality disparities by 4.69%, 11.87%, 1.70%, and 5.16%, respectively.
- Explained proportions of CVD, cancer, COPD, unintentional-injury mortality disparities between adults without psychological distress (PD) and with serious psychological distress (SPD), 1997-2014
| Model 1 | Model 2 | |||||
|---|---|---|---|---|---|---|
| Percentage points(CI) | Relative percentage(%) | Percentage points(CI) | Relative percentage(%) | |||
| Total difference between No PD(K6=0) and SPD(K6=13+) | -1.23 (-1.53,-0.93) | 100 | -1.23 (-1.53,-0.93) | 100 | ||
| Component explained by measured variables | -0.56 (-0.65,-0.48) | 45.75 | -0.62 (-0.71,-0.52) | 50.09 | ||
| Component unexplained by measured variables | -0.67 (-0.97,-0.37) | 54.25 | -0.62 (-0.91,-0.32) | 49.91 | ||
| Measured variables | Portion of explained difference | Portion of explained difference | ||||
| Absolute differences(CI) | P | Relative percentage(%) of total disparity | Absolute differences(CI) | P | Relative percentage(%) of total disparity | |
| Age | 0.05(0.00,0.10) | 0.044 | -4.17 | 0.05(0.00,0.10) | 0.044 | -4.14 |
| Sex | 0.13(0.11,0.15) | <0.001 | -10.58 | 0.15(0.13,0.17) | <0.001 | -12.39 |
| Race/ethnicity | 0.01(0.00,0.02) | 0.040 | -0.68 | 0.00(-0.01,0.01) | 0.816 | -0.08 |
| Nativity/Immigrant status | -0.02(-0.03,-0.01) | <0.001 | 1.59 | -0.02(-0.03,-0.01) | <0.001 | 1.75 |
| Education | -0.36(-0.41,-0.32) | <0.001 | 29.49 | -0.32(-0.37,-0.28) | <0.001 | 26.21 |
| Marital status | -0.07(-0.11,-0.04) | <0.001 | 5.98 | -0.07(-0.10,-0.03) | <0.001 | 5.44 |
| Poverty status(%) | -0.20(-0.26,-0.15) | <0.001 | 16.39 | -0.16(-0.21,-0.10) | <0.001 | 12.88 |
| Housing tenure | -0.09(-0.12,-0.07) | <0.001 | 7.63 | -0.09(-0.12,-0.06) | <0.001 | 7.46 |
| Region of residence | 0.00(-0.01,0.00) | 0.486 | 0.12 | 0.00(0.00,0.00) | 0.870 | -0.03 |
| Body mass index(BMI) | 0.04(0.01,0.06) | 0.002 | -3.08 | |||
| Smoking status | -0.12(-0.16,-0.08) | <0.001 | 9.76 | |||
| Alcohol consumption | -0.08(-0.11,-0.05) | <0.001 | 6.30 | |||
CI=Confidence Interval, P=P-value. Sample size=263,825. Race/ethnicity includes non-Hispanic Whites, non-Hispanic Blacks, Hispanics, American Indians/Alaska Natives, Asian/Pacific Islanders, and non-Hispanic Other Races. Education includes less than high school diploma, high school diploma, some college, and college degree or more. Poverty status includes the ratio of family income to poverty threshold of <100%; ≥100% & <200%; ≥200% & <400%; ≥400%; missing. Region includes Northeast, Midwest, South, and West. BMI includes <25, 25-29, 30-39, ≥40, and missing. Smoking status includes never former, and current smokers. Alcohol consumption includes lifetime abstainer, former drinker, current drinker, and unknown.
| Model 1 | Model 2 | |||||
|---|---|---|---|---|---|---|
| Percentage points(CI) | Relative percentage(%) | Percentage points(CI) | Relative percentage(%) | |||
| Total difference between No PD(K6=0) and SPD(K6=13+) | -1.00(-1.33,-0.68) | 100 | -1.00(-1.33,-0.68) | 100 | ||
| Component explained by measured variables | -0.38(-0.47,-0.29) | 37.46 | -0.71(-0.82,-0.61) | 71.25 | ||
| Component unexplained by measured variables | -0.63(-0.95,-0.30) | 62.54 | -0.29(-0.62,0.04) | 28.75 | ||
| Measured variables | Portion of explained difference | Portion of explained difference | ||||
| Absolute differences(CI) | P | Relative percentage(%) of total disparity | Absolute differences(CI) | P | Relative percentage(%) of total disparity | |
| Age | 0.05(0.00,0.10) | 0.044 | -4.80 | 0.05(0.00,0.09) | 0.044 | -4.69 |
| Sex | 0.13(0.11,0.15) | <0.001 | -12.96 | 0.12(0.10,0.14) | <0.001 | -11.87 |
| Race/ethnicity | 0.02(0.01,0.04) | 0.001 | -2.23 | 0.02(0.00,0.03) | 0.006 | -1.70 |
| Nativity/Immigrant status | -0.03(-0.04,-0.02) | <0.001 | 2.65 | -0.02(-0.03,-0.01) | <0.001 | 2.24 |
| Education | -0.39(-0.44,-0.34) | <0.001 | 39.23 | -0.31(-0.36,-0.26) | <0.001 | 30.98 |
| Marital status | 0.00(-0.03,0.04) | 0.845 | -0.34 | 0.03(0.00,0.07) | 0.074 | -3.13 |
| Poverty status(%) | -0.14(-0.20,-0.08) | <0.001 | 13.89 | -0.11(-0.17,-0.04) | 0.001 | 10.56 |
| Housing tenure(home ownership) | -0.02(-0.05,0.01) | 0.113 | 2.37 | 0.00(-0.03,0.03) | 0.838 | 0.30 |
| Region of residence | 0.00(0.00,0.01) | 0.188 | -0.35 | 0.00(0.00,0.01) | 0.100 | -0.42 |
| Body mass index(BMI) | 0.05(0.03,0.08) | <0.001 | -5.16 | |||
| Smoking status | -0.48(-0.53,-0.42) | <0.001 | 47.37 | |||
| Alcohol consumption | -0.07(-0.10,-0.04) | <0.001 | 6.77 | |||
CI=Confidence Interval, P=P-value. Sample size=263,825. Race/ethnicity includes non-Hispanic Whites, non-Hispanic Blacks, Hispanics, American Indians/Alaska Natives, Asian/Pacific Islanders, and non-Hispanic Other Races. Education includes less than high school diploma, high school diploma, some college, and college degree or more. Poverty status includes the ratio of family income to poverty threshold of <100%; ≥100% & <200%; ≥200% & <400%; ≥400%; missing. Region includes Northeast, Midwest, South, and West. BMI includes <25, 25-29, 30-39, ≥40, and missing. Smoking status includes never, former and current smokers. Alcohol consumption includes lifetime abstainer former drinker current drinker, and unknown.
| Model 1 | Model 2 | |||||
|---|---|---|---|---|---|---|
| Percentage points(CI) | Relative percentage(%) | Percentage points(CI) | Relative percentage(%) | |||
| Total difference between No PD(K6=0) and SPD(K6=13+) | -0.92(-1.12,-0.73) | 100 | -0.92(-1.12,-0.73) | 100 | ||
| Component explained by measured variables | -0.23(-0.26,-0.19) | 24.35 | -0.34(-0.39,-0.29) | 36.77 | ||
| Component unexplained by measured variables | -0.70(-0.89,-0.50) | 75.65 | -0.58(-0.78,-0.39) | 63.23 | ||
| Measured variables | Portion of explained difference | Portion of explained difference | ||||
| Absolute differences(CI) | P | Relative percentage(%) of total disparity | Absolute differences(CI) | P | Relative percentage(%) of total disparity | |
| Age | 0.01(0.00,0.02) | 0.045 | -1.26 | 0.01(0.00,0.02) | 0.045 | -1.20 |
| Sex | 0.02(0.01,0.03) | <0.001 | -2.36 | 0.02(0.01,0.03) | <0.001 | -2.47 |
| Race/ethnicity | 0.01(0.00,0.01) | <0.001 | -1.02 | 0.01(0.00,0.01) | 0.002 | -0.67 |
| Nativity/Immigrant status | -0.01(-0.01,-0.01) | <0.001 | 1.23 | -0.01(-0.01,-0.01) | <0.001 | 1.08 |
| Education | -0.12(-0.14,-0.10) | <0.001 | 12.78 | -0.09(-0.11,-0.07) | <0.001 | 9.80 |
| Marital status | -0.03(-0.04,-0.01) | 0.001 | 2.89 | -0.02(-0.03,0.00) | 0.050 | 1.75 |
| Poverty status(%) | -0.08(-0.11,-0.05) | <0.001 | 8.31 | -0.07(-0.09,-0.04) | <0.001 | 7.05 |
| Housing tenure(home ownership) | -0.03(-0.05,-0.02) | <0.001 | 3.55 | -0.03(-0.04,-0.01) | <0.001 | 2.73 |
| Region of residence | 0.00(0.00,0.00) | 0.058 | 0.24 | 0.00(0.00,0.00) | 0.084 | 0.22 |
| Body mass index(BMI) | 0.02(0.01,0.03) | 0.005 | -1.94 | |||
| Smoking status | -0.16(-0.19,-0.14) | <0.001 | 17.48 | |||
| Alcohol consumption | -0.03(-0.04,-0.01) | <0.001 | 2.93 | |||
CI=Confidence Interval, P=P-value. Sample size=263,825. Race/ethnicity includes non-Hispanic Whites, non-Hispanic Blacks, Hispanics, American Indians/Alaska Natives, Asian/Pacific Islanders, and non-Hispanic Other Races. Education includes less than high school diploma, high school diploma, some college, and college degree or more. Poverty status includes the ratio of family income to poverty threshold of <100%; ≥100% & <200%; ≥200% & <400%; ≥400%; missing. Region includes Northeast, Midwest, South, and West. BMI includes <25, 25-29, 30-39, ≥40, and missing. Smoking status includes never, former and current smokers. Alcohol consumption includes lifetime abstainer, former drinker, current drinker, and unknown.
| Model 1 | Model 2 | |||||
|---|---|---|---|---|---|---|
| Percentage points(CI) | Relative percentage(%) | Percentage points(CI) | Relative percentage(%) | |||
| Total difference between No PD(K6=0) and SPD(K6=13+) | -0.54(-0.7,-0.38) | 100 | -0.54(-0.70,-0.38) | 100 | ||
| Component explained by measured variables | -0.08(-0.12,-0.05) | 15.4 | -0.11(-0.15,-0.07) | 20.19 | ||
| Component unexplained by measured variables | -0.46(-0.62,-0.29) | 84.6 | -0.43(-0.60,-0.27) | 79.81 | ||
| Measured variables | Portion of explained difference | Portion of explained difference | ||||
| Absolute differences(CI) | P | Relative percentage(%) of total disparity | Absolute differences(CI) | P | Relative percentage(%) of total disparity | |
| Age | 0.00(0.00,0.00) | 0.062 | -0.36 | 0.00(0.00,0.00) | 0.058 | -0.42 |
| Sex | 0.04(0.03,0.05) | <0.001 | -7.48 | 0.04(0.03,0.05) | <0.001 | -7.65 |
| Race/ethnicity | 0.00(-0.01,0.00) | 0.650 | 0.22 | 0.00(-0.01,0.00) | 0.381 | 0.42 |
| Nativity/Immigrant status | 0.00(-0.01,0.00) | 0.141 | 0.51 | 0.00(-0.01,0.00) | 0.136 | 0.51 |
| Education | -0.06(-0.08,-0.04) | <0.001 | 10.76 | -0.05(-0.07,-0.03) | <0.001 | 9.44 |
| Marital status | -0.03(-0.04,-0.01) | <0.001 | 4.64 | -0.02(-0.03,-0.01) | 0.005 | 3.75 |
| Poverty status(%) | -0.04(-0.07,-0.01) | 0.006 | 7.38 | -0.04(-0.07,-0.01) | 0.011 | 6.82 |
| Housing tenure(home ownership) | 0.00(-0.01,0.02) | 0.678 | -0.58 | 0.01(-0.01,0.02) | 0.468 | -1.02 |
| Region of residence | 0.00(0.00,0.00) | 0.147 | 0.32 | 0.00(0.00,0.00) | 0.177 | 0.30 |
| Body mass index(BMI) | 0.02(0.01,0.02) | 0.001 | -2.90 | |||
| Smoking status | -0.06(-0.08,-0.03) | <0.001 | 10.78 | |||
| Alcohol consumption | 0.00(-0.01,0.01) | 0.865 | 0.16 | |||
CI=Confidence Interval, P=P-value. Sample size=263,825. Race/ethnicity includes non-Hispanic Whites, non-Hispanic Blacks, Hispanics, American Indians/Alaska Natives, Asian/Pacific Islanders, and non-Hispanic Other Races. Education includes less than high school diploma, high school diploma, some college, and college degree or more. Poverty status includes the ratio of family income to poverty threshold of <100%; ≥100% & <200%; ≥200% & <400%; ≥400%; missing. Region includes Northeast, Midwest, South, and West. BMI includes <25, 25-29, 30-39, ≥40, and missing. Smoking status includes never, former and current smokers. Alcohol consumption includes lifetime abstainer former drinker current drinker and unknown.
| ≤2years of mortality follow-up | ≤5years of mortality follow-up | ≤10years of mortality follow-up | ||||
|---|---|---|---|---|---|---|
| Percentage points(CI) | Relative percentage (%) | Percentage points(CI) | Relative percentage (%) | Percentage points(CI) | Relative percentage (%) | |
| Total difference between No PD(K6=0) and SPD(K6=13+) | -2.63(-3.64,-1.62) | 100 | -1.37(-1.96,-0.79) | 100 | -1.03(-1.46,-0.60) | 100 |
| Component explained by measured variables | -0.76(-1.10,-0.42) | 28.90 | -0.87(-1.07,-0.66) | 63.01 | -0.83(-0.98,-0.68) | 80.76 |
| Component unexplained by measured variables | -1.87(-2.92,-0.82) | 71.10 | -0.51(-1.12,0.11) | 36.99 | -0.20(-0.64,0.24) | 19.24 |
| Measured variables | Portion of explained difference | Portion of explained difference | Portion of explained difference | |||
| Absolute differences(CI) | Relative percentages of total disparity | Absolute differences(CI) | Relative percentages of total disparity | Absolute differences(CI) | Relative percentages of total disparity | |
| Age | -0.04(-0.17,0.09) | 1.40 | 0.01(-0.07,0.10) | -0.99 | 0.04(-0.02,0.10) | -3.87 |
| Sex | 0.08(0.03,0.13)** | -3.00 | 0.12(0.08,0.16)*** | -8.81 | 0.12(0.09,0.15)*** | -11.70 |
| Race/ethnicity | 0.02(-0.01,0.06) | -0.93 | 0.02(-0.01,0.04) | -1.11 | 0.02(0.00,0.03)* | -1.59 |
| Nativity/ Immigrant status | -0.05(-0.08,-0.02)** | 1.77 | -0.05(-0.07,-0.03)*** | 3.33 | -0.04(-0.05,-0.02)*** | 3.64 |
| Education | -0.47(-0.65,-0.29)*** | 17.99 | -0.46(-0.56,-0.35)*** | 33.25 | -0.40(-0.47,-0.33)*** | 38.52 |
| Marital status | 0.11(0.00,0.22)* | -4.22 | 0.06(-0.01,0.13) | -4.47 | 0.08(0.04,0.13)*** | -8.23 |
| Poverty status(%) | 0.20(-0.01,0.41) | -7.52 | 0.03(-0.1,0.16) | -2.05 | -0.09(-0.19,0.00)* | 9.14 |
| Housing tenure(home ownership) | -0.03(-0.13,0.07) | 0.98 | 0.00(-0.06,0.07) | -0.32 | 0.02(-0.03,0.06) | -1.48 |
| Region of residence | 0.01(-0.01,0.04) | -0.56 | 0.01(-0.01,0.02) | -0.56 | 0.00(-0.01,0.01) | -0.34 |
| Body mass index(BMI) | 0.09(0.02,0.16)** | -3.57 | 0.09(0.05,0.14)*** | -6.91 | 0.10(0.06,0.13)*** | -9.47 |
| Smoking status | -0.59(-0.77,-0.41)*** | 22.43 | -0.64(-0.76,-0.52)*** | 46.40 | -0.60(-0.69,-0.52)*** | 58.53 |
| Alcohol consumption | -0.11(-0.21,-0.01)* | 4.12 | -0.07(-0.13,-0.01)* | 5.24 | -0.08(-0.12,-0.03)*** | 7.62 |
CI=Confidence Interval, P=P-value. Sample size=267,883 (≤2 years follow-up), 268, 145 (≤5 years follow-up), 268, 145 (≤10 years follow-up). Race/ethnicity includes non-Hispanic Whites, non-Hispanic Blacks, Hispanics, American Indians/Alaska Natives, Asian/Pacific Islanders, and non-Hispanic Other Races. Education includes less than high school diploma, high school diploma, some college, and college degree or more. Poverty status includes the ratio of family income to poverty threshold of <100%; ≥100% & <200%; ≥200% & <400%; ≥400%; missing. Region includes Northeast, Midwest, South, and West. BMI includes <25, 25-29, 30-39, ≥40, and missing. Smoking status includes never, former, and current smokers. Alcohol consumption includes lifetime abstainer former drinker, current drinker and unknown. *P<0.05, **p<0.01, ***p<0.001. 1Follow-up time for individuals who died during the study period was estimated by the number of months from the month/year of interview to the month/year of death.
Higher COPD mortality for adults with SPD was explained by the measured sociodemographic factors by 24.35% in Model 1, and explained by both sociodemographic and behavioral factors by 36.77% in Model 2 (Table 4). The highest contribution to COPD mortality disparity was made by the higher rate of current smoking (17.48%) among adults with SPD. The higher COPD mortality for adults with SPD was also attributable to the lower level of education and income, and higher proportions of current and former drinkers, renters, and foreign- born among adults with SPD, by 9.80%, 7.05%, 2.93%, 2.73%, and 1.08%, respectively (Table 4, Figure 1). Younger age, higher proportion of females and racial/ethnic minorities, and higher BMI mitigated the COPD mortality disparities by 1.20%, 2.47%, 0.67%, and 1.94%, respectively.
Unintentional injury mortality difference (0.54 percentage points, 95% CI = -0.70, -0.38) between adults with no PD and those with SPD was explained by measured variables in Model 1 by 15.4% and 20.19% of the difference was explained by Model 2 (Table 5). In Model 2, higher proportion of current smokers, lower education level, lower-income, and higher proportion of non-currently married individuals contributed to higher unintentional injury mortality for adults with SPD, by 10.78%, 9.44%, 6.82%, and 3.75% respectively (Table 5, Figure 1). Higher proportions of females and higher BMI mitigated the disparities in unintentional injury mortality by 7.65% and 2.9%.
To check the robustness of the results by follow-up years due to potential time-varying risk factors, a sensitivity analysis was conducted for cancer mortality to assess variations in the contributions of individual characteristics by using 2, 5, and 10 years of mortality follow-up. The longer the follow-up years, the larger the component explained by measured variables (Table 6). This might be because the longer follow-up allows for a greater manifestation of the lagged effect of smoking, BMI, drinking, and socioeconomic disadvantage on mortality.
Discussion
Our study contributes to the existing literature by quantifying the contributions of individual characteristics in explaining the observed cause-specific mortality differences between adults with no PD and those with SPD. We found that lower levels of education and household income, and higher proportions of current smokers, former drinkers, non-married adults, US-born, and renters contributed to higher mortality for adults with SPD, while other factors such as younger age, higher proportion of females, and higher BMI mitigated this effect. The percentage of mortality disparity explained by individual sociodemographic and health behavioral disparities was higher for cancer mortality (71.25%) and CVD mortality (50.09%), compared to COPD mortality (36.77%) and unintentional injury mortality (20.19%).
The quantity of contributions of risk factors to mortality varied by cause of death but showed a similar pattern, with gaps in proportion of current smokers, education level, and income explaining a majority of the disparity in mortality between adults with no PD and those with SPD. Smoking is the most influential risk factor of cancer, COPD, and unintentional mortality disparities by SPD, showing higher percentage contribution, ranging from 10.78% to 47.37% (Figure 1). Specifically, smoking cessation among adults with SPD would eliminate around half of the cancer mortality disparity between adults with no PD and those with SPD. Lower educational level is the highest contribution to CVD mortality and the second highest to cancer, COPD, unintentional-injury mortality, ranging from 9.44% to 30.98%. In other words, enhancing the education level among adults with SPD would decrease approximately 30% of cancer or CVD mortality disparity, and around 10% of COPD and unintentional-injury mortality disparities. Lower-income is the second highest contributor to higher CVD mortality among adults with SPD and the third highest contributor to cancer, COPD, and unintentional-injury mortality disparities. Increasing income level will decrease 7 to 13 % of the disparity in cause-specific mortality.
The difference in alcohol consumption explained CVD, cancer, and COPD mortality but was not associated with unintentional-injury mortality. Higher proportions of former drinkers and lower proportions of current drinkers or lifetime abstainers explained higher CVD, cancer, and COPD mortality among adults with SPD by 3 to 7% of the disparities. Higher proportions of renters explained higher CVD and COPD mortality among adults with SPD by 7% and 3%, respectively, while the homeownership disparity was not associated with cancer and unintentional injury mortality disparities. We found that marital status differences explained higher CVD and unintentional injury mortality among adults with SPD but did not explain cancer and COPD mortality disparities. Higher proportions of widowed, divorced, separated, or never-married individuals among adults with SPD explained 4 to 5 percentage of CVD and unintentional-injury mortality disparity between an adult with no PD and those with SPD. Nativity/immigrant status also contributed to CVD, cancer, and COPD mortality disparities by 1 to 2 percent.
We also found the factors that decreased CVD, cancer, COPD, and unintentional-injury mortality disparities by SPD. Higher proportion of overweight or obesity mitigated the mortality disparity between adults with no PD and those with SPD by 2 to 5%. Higher proportion of females among adults with SPD negatively contributed to mortality disparity by 2 to 12% of the disparities. Higher proportion of racial/ ethnic minorities negatively contributed to cancer and COPD mortality by 1 to 2%. Younger populations similarly decreased the mortality disparity between adults with no PD and those with SPD by 1 to 5%.
Our findings might be explained by the fundamental cause theory, which contends that resources differ by socioeconomic status, social networks, stigmatization, resulting in disparities in the ability to avoid risks, diseases, and the consequences of a disease.27 Although the effect of social factors such as poverty on health has been alleviated through medical advances, public health initiatives, and enhanced access to care or interventions under the modern welfare system, it still persists through multiple risk-factor mechanisms.42,48,49 In particular, health behavioral factors, including smoking, exercise, and diet, have emerged as risk factors mediating the association between socioeconomic status and disease.48 Consistent with the fundamental cause theory, our study showed that existing fundamental causes such as poverty status and educational attainment still contributed greatly to mortality. The substantially high contribution of smoking to cancer mortality disparities might be a transported risk factor from existing social inequalities.48
In this study, we found that the lower level of education and household income, and higher proportions of current smokers, former drinkers, non-married adults, US-born, and renters contributed to higher mortality for adults with SPD, which have important implications for research and policy. First, tobacco control policies or cessation intervention targeting adults with SPD would be effective in mitigating mortality disparities by mental health, considering that smokers with SPD smoke a higher average number of cigarettes per day,50 and those without mental health treatment are less likely to quit smoking.51 Second, our studies shed light on the comprehensive policy approach on mental health disparities related to inequality in income and education, by providing evidence that the effect of depression on mortality could be attenuated if SES is controlled. We suggest that future studies use our single methodological frame, integrating previous findings on the association between SES and depression, SES and life expectancy, or depression and mortality.29,30,33,43 Third, other aspects of housing, such as residential segregation, crowding, housing safety and conditions, cost concerns, and community resources among adults with SPD and their association with mortality disparities,32,52,53 need to be quantified as a risk factor of mortality disparities in future studies.
Limitations
This study has some limitations. First, our study used the NHIS sample eligible for linkage to the NDI, which is, on average, 94.8% of the original NHIS survey participants.46 Excluding records ineligible for linkage may lead to biased mortality estimates. To address potential bias, we used the eligibility- adjusted sampling weight to account for the NHIS- NDI mismatches.46 Second, while our Blinder-Oaxaca decomposition included a variety of risk factors of cause-specific mortality, there could be other potential factors of mortality, confounding existing risk factors. Third, in the NHIS-NDI database, all the risk factors were available at baseline as of the survey date, while SES, behavioral-risk factors, and PD are expected to vary over the long follow-up. It is worthwhile to examine the extent of changes in SES or behavioral factors from childhood, working- age, to older ages contributing to the disparities in mortality by SPD status, using the life course approach54 with longitudinal data.
Conclusion and Implications for Translation
In this nationally representative study, we found that more than half of the CVD and cancer mortality disparity between adults with no PD and those with SPD were explained by the difference in social and behavioral determinants between the two groups. Educational level, income, and smoking status explained a majority of the disparity in CVD and cancer mortality between adults with no PD and those with SPD. Specifically, reducing rates of current smoking among adults with SPD would eliminate approximately half of the cancer mortality disparity.
Compliance with Ethical Standards
Conflicts of Interest:
None.
Financial Disclosure:
None to report.
Ethical Approval:
The study was exempt from Institutional Review Board approval as it utilized a de-identified public use dataset.
Disclaimer:
None.
Acknowledgment:
None.
Funding Source:
None.
References
- Percentage of Regularly Having Feelings of Depression for Adults Aged 18 and Over, United States, 2019, Jan-Jun. 2020, Jan-Jun. National Health Interview Survey. Generated interactively; (accessed )
- Distribution of psychological distress is stable in recent decades and follows an exponential pattern in the US population. Sci Rep. 2019;9(1):11982.
- [CrossRef] [PubMed] [Google Scholar]
- Projected spending on psychotropic medications 2013-2020. Adm Policy Ment Health. 2016;43(4):497-505.
- [CrossRef] [PubMed] [Google Scholar]
- SubstanceAbuse and Mental Health Services Administration (SAMHSA) 2014. Projections of National Expenditures for Treatment of Mental and Substance Use Disorders, 2010-2020. (accessed )
- [Google Scholar]
- Deaths:. In: Final Data for 2018. National Vital Statistics Reports; Published 2021 (accessed )
- [Google Scholar]
- Depression and the link with cardiovascular disease. Front Psychiatry. 2016;7:33.
- [CrossRef] [PubMed] [Google Scholar]
- State of the art review: depression, stress, anxiety, and cardiovascular disease. Am J Hypertens. 2015;28(11):1295-1302.
- [CrossRef] [PubMed] [Google Scholar]
- Psychological distress in relation to site specific cancer mortality: pooling of unpublished data from 16 prospective cohort studies. BMJ. 2017;356:j108.
- [CrossRef] [PubMed] [Google Scholar]
- Psychological distress and cancer mortality. J Psychosom Res. 2009;66(3):255-258.
- [CrossRef] [PubMed] [Google Scholar]
- Excess mortality due to depression and anxiety in the United States: results from a nationally representative survey. Gen. Hosp Psychiatry. 2016;39:39-45.
- [CrossRef] [PubMed] [Google Scholar]
- Depression and mortality in a longitudinal study: 1952-2011. CMAJ. 2017;189(42):E1304-E1310.
- [CrossRef] [PubMed] [Google Scholar]
- Depression as a predictor of disease progression and mortality in cancer patients: a meta-analysis. Cancer. 2009;115(22):5349-5361.
- [CrossRef] [PubMed] [Google Scholar]
- Depression and cancer risk: a systematic review and meta-analysis. Public Health. 2017;149:138-148.
- [CrossRef] [PubMed] [Google Scholar]
- Depression and cancer mortality: a meta-analysis. Psychol Med. 2010;40(11):1797-1810.
- [CrossRef] [PubMed] [Google Scholar]
- Psychological distress and heart disease mortality in the United States: results from the 1997- 2014 NHIS-NDI Record Linkage Study. Int J MCH AIDS. 2020;9(3):260-273.
- [CrossRef] [PubMed] [Google Scholar]
- Anger, anxiety, and depression as risk factors for cardiovascular disease: the problems and implications of overlapping affective dispositions. Psychol Bull. 2005;131(2):260-300.
- [CrossRef] [PubMed] [Google Scholar]
- Depression and the risk for cardiovascular diseases: systematic review and meta analysis. IntJ Geriatr Psychiatry. 2007;22(7):613-626.
- [CrossRef] [PubMed] [Google Scholar]
- Association between psychological distress and mortality: individual participant pooled analysis of 10 prospective cohort studies. BMJ. 2012;345:e4933.
- [CrossRef] [PubMed] [Google Scholar]
- Psychological distress, physical illness and mortality risk. J Psychosom Res. 2004;57(3):231-236.
- [CrossRef] [PubMed] [Google Scholar]
- Psychological distress and premature mortality in the general population: a prospective study. Ann Epidemiol. 2004;14(7):467-472.
- [CrossRef] [PubMed] [Google Scholar]
- Serious psychological distress, as measured by the K6, and mortality. Ann Epidemiol. 2009;19(3):202-209.
- [CrossRef] [PubMed] [Google Scholar]
- Psychological Distress and Mortality among Adults in the US Household Population; 2014
- Biobehavioral factors and cancer progression: physiological pathways and mechanisms. Psychosom Med. 2011;73(9):724-730.
- [CrossRef] [PubMed] [Google Scholar]
- Depression and cancer: mechanisms and disease progression. Biol Psychiatry. 2003;54(3):269-282.
- [CrossRef] [PubMed] [Google Scholar]
- Impact of anxiety and depression on chronic obstructive pulmonary disease exacerbation risk. Am J Respir Crit Care Med. 2012;185(9):918-923.
- [CrossRef] [PubMed] [Google Scholar]
- Depressive symptoms as a risk factor for unintentional injury: a cohort study in a rural county. Inj Prev. 2006;12(3):172-177.
- [CrossRef] [PubMed] [Google Scholar]
- Social conditions as fundamental causes of disease. J Health Soc Behav 1995:80-94.
- [CrossRef] [Google Scholar]
- “Fundamental causes” of social inequalities in mortality: a test of the theory. J Health Soc Behav. 2004;45(3):265-285.
- [CrossRef] [PubMed] [Google Scholar]
- Understanding the association between socioeconomic status and physical health: do negative emotions play a role? Psychol Bull. 2003;129(1):10-51.
- [CrossRef] [PubMed] [Google Scholar]
- Socioeconomic inequalities in depression: a meta-analysis. AmJ Epidemiol. 2003;157(2):98-112.
- [CrossRef] [PubMed] [Google Scholar]
- Serious psychological distress among adults: United States, 2009–2013. NCHS Data Brief. 2015;203:1-8.
- [Google Scholar]
- Health Resources and Services Administration. Office of Health Equity. In: Health Equity Report 2019-2020: Special Feature on Housing and Health Inequalities. 2020.
- [Google Scholar]
- Marked disparities in life expectancy by education, poverty level, occupation, and housing tenure in the United States, 1997-2014. Int J MCH AIDS. 2021;10(1):7-18.
- [CrossRef] [Google Scholar]
- Depression severity, diet quality, and physical activity in women with obesity and depression. J Acad Nutr Diet. 2012;112(5):693-698.
- [CrossRef] [PubMed] [Google Scholar]
- Depression is a risk factor for noncompliance with medical treatment: meta-analysis of the effects of anxiety and depression on patient adherence. Arch Intern Med. 2000;160(14):2101-2107.
- [CrossRef] [PubMed] [Google Scholar]
- The association between psychological distress and cancer mortality in the United States: results from the 1997-2014 NHIS-NDI record linkage study. Ann Behav Med. 2021;55(7):621-640.
- [CrossRef] [PubMed] [Google Scholar]
- IPUMS health surveys. National Health Interview Survey, Version 6.4 [dataset]. Published 2019 (accessed )
- Public-Use Linked Mortality File. 2019.
- It is better to be a fat ex-smoker than a thin smoker: findings from the 1997-2004 National Health Interview Survey. National Death Index linkage study. Tob Control. 2014;23(5):395-402.
- [CrossRef] [PubMed] [Google Scholar]
- Cancer disparities by race/ethnicity and socioeconomic status. CA Cancer J Clin. 2004;54(2):78-93.
- [CrossRef] [PubMed] [Google Scholar]
- Socioeconomic and racial/ethnic disparities in cancer mortality, incidence, and survival in the United States, 1950-2014: over six decades of changing patterns and widening inequalities. J Environ Public Health. 2017;2017(2819372)
- [CrossRef] [PubMed] [Google Scholar]
- Psychological distress, life expectancy, and all-cause mortality in the United States: results from the 1997-2014 NHIS-NDI record linkage study. Ann Epidemiol. 2021;56:9-17.
- [CrossRef] [Google Scholar]
- The Blinder–Oaxaca decomposition for linear regression models. Stata J. 2008;8(4):453-479.
- [CrossRef] [Google Scholar]
- Explaining differences between groups: Oaxaca decomposition. Anal Heal Equity Using Househ Surv Data 2008
- [CrossRef] [Google Scholar]
- The Linkage of National Center for Health Statistics Survey Data to the National Death Index — 2015 Linked Mortality File (LMF): Methodology Overview and Analytic Considerations. Office of Analysis and Epidemiology 2019
- [Google Scholar]
- Stata Statistical Software: Release 17 2021
- Understanding sociodemographic differences in health--the role of fundamental social causes. Am J Public Health. 1996;86(4):471-473.
- [CrossRef] [PubMed] [Google Scholar]
- Social determinants of health in the United States: addressing major health inequality trends for the nation, 1935-2016. Int J MCH AIDS. 2017;6(2):139-164.
- [CrossRef] [Google Scholar]
- Smoking and mental illness: results from population surveys in Australia and the United States. BMC Public Health. 2009;9:285.
- [CrossRef] [PubMed] [Google Scholar]
- Trends in smoking among adults with mental illness and association between mental health treatment and smoking cessation. JAMA. 2014;311(2):172-182.
- [CrossRef] [PubMed] [Google Scholar]
- WHO Housing and Health Guidelines. Geneva: World Health Organization; 2018.
- Housing and health: time again for public health action. AmJ Public Health. 2002;92(5):758-768.
- [CrossRef] [PubMed] [Google Scholar]
- Social determinants of mental health. Int Rev Psychiatry. 2014;26(4):392-407.
- [CrossRef] [PubMed] [Google Scholar]