Translate this page into:
Comparing Homicidal Ideations with Homicides/Assaults Victimization among Various Racial/Ethnic Groups in the United States
Abstract
Introduction:
Multiple and diverse contributors of homicidal ideation and homicidal/assault victimization exist. Although multiple studies have been conducted to examine the homicidal victimization, there is dearth in the literature regarding homicidal ideation. Therefore, we undertook this study to investigate and compare perpetrators of homicide to victims of homicide or assault, based on race and ethnicity.
Methods:
We conducted a retrospective cross-sectional analysis of inpatient hospitalizations in the US from January 1,2010 and December 31,2017 using Nationwide Inpatient Sample data. We estimated the risk of homicidal ideation and homicidal/assault victims among various racial/ethnic groups using survey logistic regression models, while adjusting for patient demographic and hospitalization characteristics. R and RStudio were utilized to conduct all statistical analyses and Joinpoint Regression Program for conducting temporal trends analyses.
Results:
During the study duration 2010-2017, there were 358,687 (0.12%) hospitalizations related to homicidal ideation. In 2017, the rate of homicidal/assault victimization related hospitalizations were 0.20%. After adjusting for covariates, Non-Hispanic (NH)-Blacks had an increased likelihood (Odds Ratio (OR): 1.41,95% Confidence Interval (CI): 1.17-1.69) to have homicidal ideations and to be victims of assault and homicide (OR: 2.38, 95% CI: 2.06-2.75) compared to NH-Whites.
Conclusions and Implication for Translation:
Our study shows that significant racial/ethnic disparities exist for homicidal ideation and being victims of homicide and assault in the US during the study period. Targeted mental and behavioral health intervention towards NH-Black community could help prevent them from becoming perpetrators and victims of homicide.
Keywords
Homicidal Ideation
Homicide Victim
Assault Victim
Racial disparities
Nationwide Inpatient Sample Database

Introduction
Homicide affects society with longstanding psychological and socioeconomic impact. The United Nations calculates global homicides as a proportion of the population worldwide. In 2017, the estimated average homicide rate was 6.1 per 100, 000 persons globally.1 Homicide rate peaked in 1993 when it reached 7.4 per 100, 000 persons globally which means the global homicide rate has declined over the last two decades.2 According to the Centers for Disease Control and Prevention (CDC), in 2017, the age-adjusted homicide rate was 6.0 per 100,000 United States (US) standard population.2 In the US, the highest homicide rate occurred in 1980 at a rate of 10.4 per 100,000 standard population.2 Over the last three decades, homicide rates have decreased in the US but since 2010, they have slowly increased.3 Health disparities exist as reported in studies since the 1940s showing non-Hispanic Black males have had higher homicide rates.4-6 In fact, the CDC reported that, in 2017, the leading cause of death of African-American males of ages 1-44 years was homicide.7
According to a national study, patients with homicidal ideations have a high likelihood of serious psychiatric illnesses.8 In pediatric patients, the odds of homicidal ideation was increased with behavioral and emotional disorders, peaking in ages 5-17 years.9 Researchers found an association between perpetrators or victims of bullying and homicidal ideations among middle and high school students in China.10
A study in 2020 looked at education, race/ethnicity and potential years of life lost among the middle-aged in urban US, finding that Black males had the highest age-adjusted premature death rates with homicide and that education as an independent predictor.11 From 2015-2017, fatal police shootings rates were higher for Blacks and Hispanics, occurring more in urban areas whereas among Whites, rates were higher in rural areas.12 Another study in urban US showed that minorities were disproportionally exposed to gun fatalities, which was associated with a higher prevalence of mental health disorders.13 Although there have been few studies examining homicidal ideations and homicidal victims, there have been no studies, to our knowledge, to compare the factors associated with homicidal ideations and homicide/assault victims by race/ethnicity Therefore, we undertook this study to investigate and compare perpetrators of homicide to victims of homicide/assault based on race and ethnicity. By reviewing hospitalizations in the US, we looked for socio-demographic and hospital characteristics associated with homicidal ideation and victimization among various racial/ethnic groups. We hypothesize that minority groups would be impacted more by homicidal ideations and homicide/assault victimization, with most prominent effects among young Black males.
Methods
Study Design and Data Source
We conducted a retrospective cross-sectional analysis of inpatient hospitalizations in the US using data from the Healthcare Cost and Utilization Project's (HCUP's) National Inpatient Sample (NIS).14 The NIS constitutes the largest all-payer, publicly available inpatient database in the US. HCUP uses a two-stage cluster sampling design to create the sample annually, which first stratifies participating non-federal community hospitals by five characteristics: urban/rural location, number of beds, geographic region, type of ownership, and teaching status. Then, 20% of hospitals from each stratum are selected by using a systematic random sampling technique. In the second stage, all inpatient hospitalizations from hospitals selected during stage one are selected for inclusion in the NIS. The NIS approximates a 20% systematic sample that is representative of the population of all inpatient hospitalizations on critical hospital and patient characteristics. In 2017, the latest year for which the data was available at the time of the study, 47 states participated in the NIS, representing over 35 million hospitalizations when weighted.
Population
Our target population consisted of patients with a diagnosis of homicidal ideation admitted to hospitals in the US between January 1, 2010 and December 31, 2017. We used the International Classification of Diseases, Ninth Edition, Clinical Modification (ICD- 9-CM) codes till 3rd quarter of 2015 and ICD-10- CM codes thereafter, for each patient's principal diagnosis and up to 30 secondary diagnoses. We selected hospitalizations with homicidal ideation in patients using any principal diagnosis or secondary diagnosis using ‘V62.85’ in the ICD-9-CM coding system and ‘R45.850’ in ICD-10-CM. For studying the diagnosis of homicidal or assault victim, we used NIS data for the year 2017, as the information on the diagnosis was available only in the 2017 data. ICD-10-CM beginning with X9 and Y0 were used to categorize homicidal/assault victim among all hospitalized patients in the data.
For each inpatient hospitalization, the NIS database captures various socio-demographic, clinical, and hospital characteristics. Patient age in years was categorized as 0-14; 15-29; 30–44; 45–59; and ≥ 60. Self-reported race/ethnicity, which is reported differently across states, was standardized by first grouping this as Hispanic or Non-Hispanic (NH), and then further classifying the non-Hispanics by race (NH-White, NH-Black, or Other). Insurance status was based on the primary payer for the hospitalization, and was classified into Medicare, Medicaid, private, self-pay and other. Socioeconomic status was estimated from the median household income in the patient's zip code of residence, and estimated values were classified into quartiles.
We also considered several characteristics of the treating hospital that are captured within the NIS databases, including US census region (Northeast, Midwest, South, and West), hospital size based on the number of short-term acute beds in a hospital (small, medium, large), and location/teaching status (urban- teaching, urban-non-teaching, and rural).
Statistical Analysis
Statistical analyses were performed using R (version 3·6·1) and RStudio (Version 1·2·5001) (R Foundation), and trend analyses used the Joinpoint Regression Program, version 4.7.0.0.15 We used NIS- provided sampling weights to calculate national estimates of the frequency and prevalence of the two outcomes of interest. Descriptive statistics were used to outline the distribution of sociodemographic, clinical, and hospital characteristics in patients with homicidal ideation and homicidal/ assault victim diagnosis. Furthermore, we calculated the prevalence of homicidal ideation and homicidal/ assault victims among NH-Whites, NH-Blacks and Hispanics.
Joinpoint regression was used to estimate and describe temporal trends in the occurrence of homicidal ideation among hospitalized patients. Joinpoint regression is particularly useful for identifying changes in the frequency and rates of events over time.15 First, joinpoint regression assumed that a single trend best described outcome rates over time; therefore, it fit the data to a straight line (one with no joinpoints). A joinpoint was then added to the model, and a Monte Carlo permutation test was used to determine whether it offered a statistically significant improvement to the model. The process of adding joinpoints continued iteratively until an optimal number of joinpoints were identified. Each joinpoint reflected a statistically significant change in the temporal trend, and the model estimated the average annual percent change (AAPC) to describe how the rate of homicidal ideation changed during the study period.15
Lastly, we conducted adjusted survey logistic regression to generate adjusted odds ratios (OR) and 95% confidence intervals (CI) representing the association between each patient and hospital characteristic as exposure and homicidal ideation and homicidal/assault victim as outcome. A 5% type I error rate was assumed for all hypothesis tests (two-sided). Since NIS data are de-identified and publicly available, this study was classified as exempt by the Baylor College of Medicine Institutional Review Board.
Results
There were a total of 288,999,700 hospitalizations in the US from 2010-2017. The corresponding hospitalizations for homicidal ideations were 358,687 (0.12%). In 2017, out of a total 35,798,453 hospitalizations, the rate of homicidal/assault victimization related hospitalizations were 0.20%. The highest prevalence of homicidal ideations were among age groups 15-29 years (30.27/10,000 hospitalizations) and 30-44 years (25.65/10,000 hospitalizations). These groups also had the highest prevalence of homicidal/assault victimization at 64.83 and 45.34/10,000 hospitalizations respectively. By race/ethnicity, the prevalence of homicidal ideations and homicide/assault victimizations were highest for NH-Blacks at 24.96 and 47.43/10,000 hospitalizations respectively. NH- Whites (10.20/10,000 hospitalization) and Hispanics (10.60/10,000 hospitalization) had similar prevalence of homicidal ideations; however, the prevalence of homicide/assault victimizations was higher for Hispanics (28.75) compared to Whites (10.88). The prevalence of homicidal ideation and homicide/assault victimization was highest among those who were discharged against medical advice (DAMA). There was an inverse dose-response relationship between Zipcode income level and the homicidal ideations and homicidal/assault victimization. Medicaid patients had the highest prevalence of homicidal ideations and homicide/assault victimization at 24.51 and 39.88/10,000 hospitalization, respectively. The highest prevalence of homicidal ideation and homicidal/assault victimization were found in urban- teaching hospitals (Table 1).
| Total | Homicidal Ideation | Total | Homicidal / Assault victimization | |||||
|---|---|---|---|---|---|---|---|---|
| N | N | % | Prevalence1 | N | N | % | Prevalence1 | |
| Total | 288,999,700 | 358687 | 100% | 35,798,453 | 69990 | 100% | ||
| Patient Characteristics | ||||||||
| Age | ||||||||
| 0-14 years | 41866377 | 34238 | 9.5% | 8.17 | 5035461 | 2735 | 3.9% | 5.43 |
| 15-29 years | 34590866 | 105031 | 29.3% | 30.27 | 4083297 | 26645 | 38.1% | 64.83 |
| 30-44 years | 39182582 | 100750 | 28.1% | 25.65 | 4826867 | 21985 | 31.4% | 45.34 |
| 45-59 years | 50740436 | 88973 | 24.8% | 17.50 | 5988113 | 13810 | 19.7% | 23.01 |
| 60+ years | 122619439 | 29695 | 8.3% | 2.42 | 15864715 | 4815 | 6.9% | 3.03 |
| Race | ||||||||
| NH-White3 | 176639296 | 180278 | 50.3% | 10.20 | 22225090 | 24205 | 34.6% | 10.88 |
| NH-Black3 | 40811092 | 102107 | 28.5% | 24.96 | 5249742 | 25020 | 35.7% | 47.43 |
| Hispanic | 32985998 | 35006 | 9.8% | 10.60 | 4280848 | 12345 | 17.6% | 28.75 |
| Other | 18687136 | 17089 | 4.8% | 9.14 | 2511116 | 5615 | 8.0% | 22.31 |
| Missing | 19876177 | 24207 | 6.7% | 12.16 | 1531658 | 2805 | 4.0% | 18.28 |
| Discharge Status | ||||||||
| Routine | 201959513 | 300640 | 83.8% | 14.86 | 24407188 | 57245 | 81.8% | 23.40 |
| Transfer | 45347725 | 48701 | 13.6% | 10.73 | 5715492 | 5540 | 7.9% | 9.68 |
| Died | 5464321 | 100 | 0.0% | 0.18 | 698690 | 855 | 1.2% | 12.22 |
| DAMA2 | 3166960 | 5780 | 1.6% | 18.22 | 470665 | 3165 | 4.5% | 66.80 |
| Other | 32862969 | 2864 | 0.8% | 0.87 | 4482268 | 3055 | 4.4% | 6.81 |
| Missing | 198212 | 602 | 0.2% | 30.28 | 24150 | 130 | 0.2% | 53.54 |
| Zip Income quartile | ||||||||
| Lowest quartile | 84916223 | 146043 | 40.7% | 17.17 | 10680030 | 32320 | 46.2% | 30.17 |
| 2nd quartile | 72660848 | 90309 | 25.2% | 12.41 | 9312561 | 15665 | 22.4% | 16.79 |
| 3rd quartile | 67855152 | 65945 | 18.4% | 9.71 | 8277359 | 11650 | 16.6% | 14.05 |
| Highest quartile | 57580351 | 42011 | 11.7% | 7.29 | 6946894 | 7230 | 10.3% | 10.40 |
| Missing | 5987125 | 14378 | 4.0% | 23.96 | 581610 | 3125 | 4.5% | 53.44 |
| Primary Payer | ||||||||
| Medicare | 113256794 | 82874 | 23.1% | 7.31 | 14513926 | 6155 | 8.8% | 4.24 |
| Medicaid | 62989222 | 154797 | 43.2% | 24.51 | 8270728 | 33115 | 47.3% | 39.88 |
| Private Insurance | 88610085 | 69333 | 19.3% | 7.82 | 10448044 | 12000 | 17.1% | 11.47 |
| Self- Pay | 23579213 | 50495 | 14.1% | 21.37 | 2501090 | 18400 | 26.3% | 73.03 |
| Other/Missing | 564387 | 1188 | 0.3% | 21.01 | 64665 | 320 | 0.5% | 49.24 |
| Hospital Characteristics | ||||||||
| Hospital Region | ||||||||
| Northeast | 54434316 | 55780 | 15.6% | 10.24 | 6571470 | 12875 | 18.4% | 19.55 |
| Midwest | 64943467 | 96455 | 26.9% | 14.83 | 7982265 | 13090 | 18.7% | 16.37 |
| South | 112318304 | 151532 | 42.2% | 13.47 | 14063640 | 25940 | 37.1% | 18.41 |
| West | 57303613 | 54920 | 15.3% | 9.57 | 7181078 | 18085 | 25.8% | 25.12 |
| Hospital Bed Size | ||||||||
| Small | 45390367 | 59830 | 16.7% | 13.16 | 7137462 | 8000 | 11.4% | 11.20 |
| Medium | 78831792 | 90228 | 25.2% | 11.43 | 10540587 | 18570 | 26.5% | 17.59 |
| Large | 163775012 | 207456 | 57.8% | 12.65 | 18120404 | 43420 | 62.0% | 23.90 |
| Missing | 1002529 | 1173 | 0.3% | 11.69 | 0 | 0.0% | - | |
| Hospital Location and Teaching Status | ||||||||
| Rural | 29984723 | 32908 | 9.2% | 10.96 | 3226683 | 2245 | 3.2% | 6.95 |
| Urban non-teaching | 92663654 | 102752 | 28.6% | 11.08 | 7950866 | 7980 | 11.4% | 10.03 |
| Urban teaching | 165348793 | 221853 | 61.9% | 13.40 | 24620904 | 59765 | 85.4% | 24.22 |
| Missing | 1002529 | 1173 | 0.3% | 11.69 | 0 | 0 | 0.0% | - |
1Prevalence: Prevalence is reported per 10,000 hospitalizations. 2DAMA = Discharged Against Medical Advice. 3NH-Non-Hispanic. 4Total - Total Hospitalizations
We observed that NH-Blacks in the age group 15-29 had the highest prevalence of homicidal ideations and homicides/assaults at 45.3/10,000 hospitalizations and 105.3/10,000 hospitalizations, respectively. Hispanics of the same age group had the lowest prevalence of homicidal ideation at 18.5/10,000 hospitalizations; however, they had a higher prevalence of homicides/assaults at 47.3/10,000 compared to Whites at 42.4/10,000 hospitalizations. The majority of patients with homicidal ideation or victimization were discharged against medical advice, Medicaid or were from areas with the lowest income regardless of race/ethnicity. The prevalence of homicidal ideation hospitalization was highest of hospitals in the Midwest at 33.7/10,000 for NH-Blacks, 14.0/10,000 for Hispanics and 12.2/10,000 for NH-Whites. The prevalence of hospitalizations for victims of homicides/ assaults for NH-Blacks was highest among hospitals in the West at 44.6/10,000; whereas for NH-Whites and Hispanics, prevalence of homicides/assaults were highest in hospitals in the Midwest at 16.7/10,000 and 21.7/10,000 respectively. NH-Whites and Hispanics had a higher prevalence of homicidal ideation at urban hospitals but higher prevalence of victimization of homicides/assaults at rural hospitals. NH-Blacks had higher prevalence of homicidal ideation and homicides/assaults in urban hospital (Table 2).
| NH-White3 | NH-Black3 | Hispanic | ||||||||||
|---|---|---|---|---|---|---|---|---|---|---|---|---|
| Homicidal Ideation | Homicide/assault victimization | Homicidal Ideation | Homicide/assault victimization | Homicidal Ideation | Homicide/assault victimization | |||||||
| % | Prevalence | % | Prevalence | % | Prevalence | % | Prevalence | % | Prevalence | % | Prevalence | |
| Patient Characteristics | 100.0% | 100.0% | 100.0% | 100.0% | 100.0% | 100.0% | ||||||
| Age | ||||||||||||
| 0-14 years | 9.2% | 8.6 | 7.6% | 10.1 | 64.1% | 13.4 | 3.2% | 8.2 | 13.5% | 6 | 2.1% | 1.5 |
| 15-29 years | 28.3% | 30.2 | 27.5% | 42.4 | 15.7% | 45.3 | 45.7% | 105.3 | 33.3% | 18.5 | 53.7% | 47.3 |
| 30-44 years | 27.9% | 24 | 28.9% | 34.4 | 16.1% | 43.8 | 35.0% | 75.3 | 28.4% | 17.3 | 34.7% | 31.3 |
| 45-59 years | 24.3% | 14.1 | 23.5% | 19.6 | 17.0% | 33 | 15.4% | 24.9 | 18.6% | 13.5 | 6.7% | 7.1 |
| 60+ years | 10.3% | 2.1 | 12.5% | 3.3 | 3.6% | 5 | 0.7% | 0.7 | 6.1% | 2.6 | 2.8% | 1.6 |
| Discharge Status | ||||||||||||
| Routine | 82.7% | 12.8 | 82.1% | 17.8 | 48.4% | 29.6 | 85.3% | 42 | 85.3% | 11.1 | 87.4% | 17.4 |
| Transfer | 14.6% | 8.2 | 14.6% | 10.9 | 6.8% | 22.3 | 12.0% | 30 | 12.5% | 15.7 | 10.7% | 18.6 |
| Died | 0.0% | 0.2 | 0.1% | 0.4 | 0.0% | 0 | 0.0% | 0 | 0.0% | 0.3 | 0.0% | 0 |
| DAMA2 | 1.6% | 16.3 | 2.0% | 22.6 | 1.0% | 24.7 | 1.8% | 32.5 | 1.4% | 13.8 | 1.2% | 13.8 |
| Other | 0.9% | 0.7 | 1.0% | 1 | 0.4% | 1.7 | 0.7% | 2 | 0.6% | 0.9 | 0.4% | 0.8 |
| Missing | 0.2% | 32.2 | 0.2% | 33.5 | 0.1% | 47 | 0.2% | 64.2 | 0.2% | 33.1 | 0.3% | 176.2 |
| Zip Income quartile | ||||||||||||
| Lowest quartile | 32.8% | 13.8 | 34.8% | 19.8 | 31.1% | 27.2 | 56.3% | 37.3 | 46.3% | 13 | 46.7% | 19.5 |
| 2nd quartile | 28.7% | 11.1 | 28.6% | 14.3 | 11.3% | 23.9 | 19.0% | 31.2 | 22.7% | 9.9 | 22.1% | 13.6 |
| 3rd quartile | 21.2% | 8.6 | 20.1% | 11.2 | 7.4% | 20.7 | 11.9% | 27.2 | 16.7% | 8 | 15.4% | 11.4 |
| Highest quartile | 14.0% | 6.3 | 12.6% | 8 | 4.4% | 19 | 7.1% | 25.9 | 8.2% | 6.6 | 8.4% | 10.3 |
| Missing | 3.4% | 20.2 | 3.9% | 35.5 | 2.5% | 42.6 | 5.7% | 125.2 | 6.1% | 24.2 | 7.5% | 62 |
| Primary Payer | ||||||||||||
| Medicare | 26.0% | 5.8 | 24.8% | 7.2 | 12.1% | 16.1 | 20.3% | 20.5 | 17.1% | 8.3 | 17.5% | 11.8 |
| Medicaid | 36.5% | 26 | 41.2% | 36.9 | 29.1% | 37.3 | 54.4% | 52.8 | 51.0% | 12.7 | 59.0% | 21.8 |
| Private Insurance | 22.5% | 7.1 | 20.7% | 9.4 | 7.4% | 14.7 | 12.0% | 19.5 | 17.8% | 7.9 | 11.7% | 7.9 |
| Self Pay | 14.6% | 21.1 | 12.9% | 29.7 | 7.9% | 35.2 | 12.9% | 54.3 | 13.8% | 12.7 | 11.6% | 19.1 |
| Other/ Missing | 0.3% | 17.9 | 0.4% | 33 | 0.2% | 38.6 | 0.3% | 59.1 | 0.3% | 25.1 | 0.2% | 32.5 |
| Hospital Characteristics | ||||||||||||
| Hospital Region | ||||||||||||
| Northeast | 17.1% | 8.6 | 16.2% | 11.6 | 8.2% | 18.4 | 14.4% | 28.9 | 16.5% | 11.2 | 16.2% | 17 |
| Midwest | 27.4% | 12.2 | 30.8% | 16.7 | 14.7% | 33.7 | 24.6% | 42 | 9.3% | 14 | 10.3% | 21.7 |
| South | 41.8% | 10.8 | 39.8% | 14.4 | 28.1% | 23.8 | 49.6% | 32.2 | 40.6% | 11.2 | 38.2% | 15.4 |
| West | 13.7% | 8 | 13.2% | 10.9 | 5.6% | 28.1 | 11.4% | 44.6 | 33.6% | 9.2 | 35.3% | 14.9 |
| Hospital Bed Size | ||||||||||||
| Small | 16.1% | 9.9 | 21.1% | 14.1 | 9.2% | 30.5 | 22.6% | 42.5 | 19.9% | 15.3 | 23.7% | 20.9 |
| Medium | 25.6% | 9.6 | 25.2% | 12 | 14.6% | 23 | 25.7% | 29.8 | 23.1% | 8.7 | 25.1% | 12.8 |
| Large | 58.0% | 10.6 | 53.7% | 14.8 | 32.8% | 24.8 | 51.7% | 34.9 | 56.3% | 10.4 | 51.2% | 16 |
| Missing | 0.3% | 9.3 | 0.0% | - | 0.1% | 13 | 0.0% | - | 0.7% | 18.9 | 0.0% | - |
| Hospital Location and Teaching Status | ||||||||||||
| Rural | 11.8% | 9.7 | 11.6% | 14.5 | 2.5% | 19.7 | 4.0% | 25.6 | 4.0% | 10.5 | 5.3% | 24.9 |
| Urban non-teaching | 31.1% | 9.2 | 21.2% | 12.4 | 14.9% | 26.7 | 16.2% | 34.8 | 31.3% | 9.7 | 21.7% | 14.9 |
| Urban teaching | 56.7% | 11 | 67.1% | 14.3 | 39.1% | 24.9 | 79.9% | 35.4 | 64.1% | 11.1 | 73.0% | 15.8 |
| Missing | 0.3% | 9.3 | 0.0% | – | 0.1% | 13 | 0.0% | – | 0.7% | – | 0.0% | – |
DAMA=Discharged Against Medical Advice
The trend in the rates of homicidal ideation from 2010 to 2017 showed an overall increase from less than 5 per 10,000 hospitalizations in 2010 to about 15 per 10,000 in 2012 at which point it levelled. NH- Blacks had a sharp rise of hospitalization related to homicidal ideation from less than 5 per 10,000 in 2010 to 30 per 10,000 in 2012 with a slowed yet continuous rise till the end of the study period. NH- Whites and Hispanics had a similar pattern of rise from less than 5 per 10,000 to just above 10 per 10,000 in 2012 at which point it levelled for NH- Whites and slightly increased to 15 per 10,000 for Hispanics. (Figure 1).
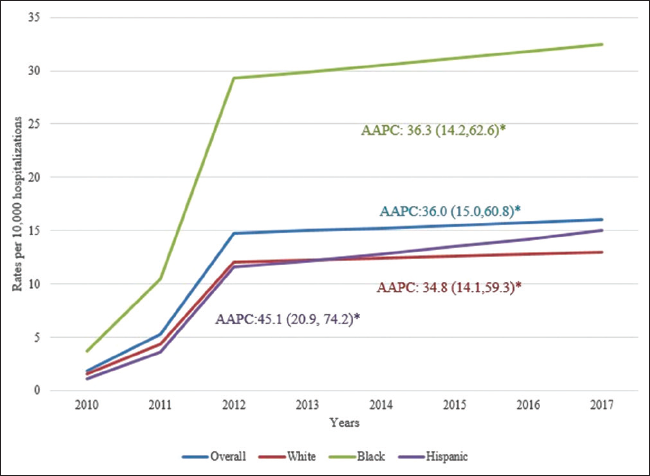
- Trends in the rates of homicidal ideation related hospitalizations by race/ethnicity: 2010 to 2017 (AAPC = average annual percent change derived by Joinpoint regression) *Represents statistically significant findings with p-value <0.05.
NH-Blacks were 41% more likely to have homicidal ideations (OR=1.41, 95% CI: 1.17-1.69) and more than twice as likely (OR=2.38, 95% CI: 2.06-2.75) to be murdered or assaulted compared to NH-Whites (Table 3). Hispanics were about 33% more likely to experience homicide or assault (OR=1.33, 95% CI: 1.10-1.61) compared to NH-Whites. Overall, the age group 15-29 was around 3 times as likely to have homicidal ideation and 10 times as likely to experience homicides and assaults. NH-Blacks and Hispanics aged 15-29 were 3.5 times and 3 times as likely to have homicidal ideations respectively, and they also were 12 and 15.5 times as likely to be murdered, respectively. Overall, patients in the lowest income ZIP codes had around 40% increased likelihood of homicidal ideations (OR=1.42) and homicides/assaults (OR=1.48). NH-Whites and Hispanics in the lowest income ZIP codes had 73% (95%CI: 1.17-2.57)) and 78% (95% CI: 1.52-2.09) increased likelihood of homicidal ideations, respectively; however, NH-Blacks had 68% more likelihood of being victims of assaults/homicides (95% CI: 1.37-2.06). Overall, Medicaid patients were around thrice as likely to be victims of homicide or assault as compared to those on Medicare (Table 3).
| Overall | NH-White | NH-Black | Hispanic | |||||
|---|---|---|---|---|---|---|---|---|
| Homicidal Ideation OR (CI) | Homicide/ Assault Victimization OR (CI) | Homicidal Ideation OR (CI) | Homicide/ Assault Victimization OR (CI) | Homicidal Ideation OR (CI) | Homicide/ Assault Victimization OR (CI) | Homicidal Ideation OR (CI) | Homicide/ Assault Victimization OR (CI) | |
| Patient Characteristics | ||||||||
| Race | ||||||||
| NH-White | Reference | |||||||
| NH-Black | 1.41 (1.17-1.69) | 2.38 (2.06-2.75) | ─ | ─ | ─ | ─ | ─ | ─ |
| Hispanic | 0.57 (0.44-0.75) | 1.33 (1.1-1.61) | ─ | ─ | ─ | ─ | ─ | ─ |
| Other | 0.78 (0.56-1.11) | 1.27 (1.02-1.58) | ─ | ─ | ─ | ─ | ─ | ─ |
| Age | ||||||||
| 0-14 years | Reference | |||||||
| 15-29 years | 3.03 (2.32-3.94) | 10.19 (7.75-13.41) | 2.86 (1.93-4.23) | 10.23 (5.97-17.53) | 3.41 (3.06-3.79) | 12.24 (9.86-15.2) | 3.08 (2.47-3.84) | 15.49 (11.77-20.38) |
| 30-44 years | 2.37 (1.79-3.14) | 8.46 (6.43-11.15) | 2.06 (1.36-3.12) | 9.2 (5.36-15.77) | 3.59 (3.18-4.06) | 8.5 (6.84-10.58) | 2.83 (2.22-3.61) | 11.64 (8.73-15.53) |
| 45-59 years | 1.77 (1.32-2.36) | 4.77 (3.57-6.38) | 1.22 (0.78-1.89) | 5.45 (3.11-9.56) | 2.73 (24-3.1) | 3.9 (3.1-4.89) | 1.85 (1.44-2.37) | 7.46 (5.53-10.07) |
| 60+ years | 0.15 (0.1-0.24) | 1.15 (0.8-1.66) | 0.1 (0.05-0.18) | 1.1 (0.55-2.2) | 0.4 (0.34-0.46) | 1.24 (0.95-1.61) | 0.22 (0.16-0.29) | 1.8 (1.27-2.55) |
| Zip Income quartile | ||||||||
| Highest quartile | Reference | |||||||
| Lowest quartile | 1.42 (1.09-1.85) | 1.48 (1.21-1.8) | 1.73 (1.17-2.57) | 1.23 (0.91-1.66) | 1.17 (1.05-1.3) | 1.68 (1.37-2.06) | 1.78 (1.52-2.09) | 1.4 (1.15-1.71) |
| 2nd quartile | 1.26 (0.96-1.64) | 1.05 (0.86-1.27) | 1.76 (1.19-2.59) | 0.99 (0.74-1.34) | 1.05 (0.94-1.16) | 1.18 (0.95-1.45) | 1.36 (1.18-1.56) | 1.08 (0.9-1.28) |
| 3rd quartile | 1.07 (0.82-1.4) | 0.97 (0.78-1.2) | 1.58 (1.08-2.32) | 0.92 (0.69-1.24) | 0.97 (0.89-1.06) | 1.1 (0.92-1.31) | 1.15 (1.01-1.31) | 1.04 (0.87-1.25) |
| Primary Payer | ||||||||
| Medicare | Reference | |||||||
| Medicaid | 0.81 (0.62-1.05) | 2.83 (2.19-3.66) | 0.63 (0.44-0.91) | 2.1 (1.39-3.17) | 1.03 (0.96-1.1) | 2.73 (2.36-3.16) | 0.51 (0.43-0.59) | 2.42 (1.89-3.09) |
| Private Insurance | 0.35 (0.27-0.46) | 1.25 (0.95-1.64) | 0.23 (0.16-0.34) | 0.56 (0.36-0.86) | 0.44 (0.4-0.48) | 1.65 (1.38-1.98) | 0.34 (0.29-0.4) | 1.25 (0.97-1.62) |
| Self-Pay | 0.7 (0.52-0.95) | 6.37 (4.9-8.29) | 0.65 (0.44-0.96) | 4.21 (2.81-6.29) | 0.89 (0.82-0.96) | 7.29 (6.19-8.59) | 0.45 (0.39-0.53) | 6.34 (4.94-8.13) |
| Discharge Status | ||||||||
| Routine | Reference | |||||||
| Transfer | 1.57 (1.23-2) | 1.21 (0.98-1.5) | 1.16 (0.82-1.64) | 1.05 (0.76-1.47) | 1.26 (1.17-1.35) | 1.06 (0.9-1.24) | 2.3 (2.04-2.59) | 1.36 (1.13-1.63) |
| Died | 0.03 (0.01-0.12) | 0.93 (0.55-1.58) | 0(0-0) | 0.77 (0.32-1.84) | 0(0-0) | 1.47 (1.12-1.92) | 0.06 (0.02-0.17) | 1.05 (0.63-1.75) |
| DAMA | 0.87 (0.51-1.49) | 1.49 (1.14-1.94) | 0.74 (0.33-1.69) | 1.39 (0.9-2.13) | 0.61(0.54-0.69) | 1.15 (1-1.33) | 0.94 (0.75-1.18) | 1.98 (1.61-2.43) |
| Other | 0.05 (0.02-0.17) | 0.76 (0.58-0.99) | 0.03 (0-0.23) | 0.61 (0.39-0.97) | 0.09(0.07- 0.11) | 0.9 (0.75-1.08) | 0.12 (0.09-0.17) | 0.7 (0.53-0.94) |
| Hospital Characteristics | ||||||||
| Hospital Region | ||||||||
| Northeast | Reference | |||||||
| Midwest | 1.25 (0.96-1.61) | 0.92 (0.73-1.17) | 1.12 (0.78-1.61) | 1.04 (0.73-1.47) | 1.78 (1.53-2.08) | 0.82 (0.61-1.1) | 1.37 (1.09-1.74) | 0.74 (0.52-1.03) |
| South | 1.07 (0.84-1.35) | 0.79 (0.63-0.98) | 1.04 (0.74-1.46) | 1.1 (0.79-1.54) | 1.33 (1.16-1.53) | 0.63 (0.49-0.81) | 1.08 (0.85-1.38) | 0.66 (0.48-0.91) |
| West | 0.8 (0.59-1.09) | 1.29 (1.02-1.64) | 0.71 (0.46-1.11) | 1.85 (1.32-2.61) | 1.46 (1.07-1.99) | 1.33 (1.01-1.76) | 0.88 (0.67-1.16) | 1.28 (0.96-1.72) |
| Hospital Bed Size | ||||||||
| Small | Reference | |||||||
| Medium | 0.89 (0.68-1.15) | 1.54 (1.19-2.00) | 1.04 (0.72-1.51) | 1.31 (0.93-1.85) | 0.74 (0.62-0.89) | 1.69 (1.2-2.39) | 0.57 (0.41-0.81) | 1.61 (1.17-2.23) |
| Large | 0.91 (0.72-1.15) | 2.17 (1.73-2.72) | 1.2 (0.86-1.66) | 1.8 (1.32-2.46) | 0.78 (0.66-0.92) | 2 (1.5-2.66) | 0.69(0.5- 0.94) | 1.97 (1.46-2.65) |
| Hospital Location and Teaching Status | ||||||||
| Rural | Reference | |||||||
| Urban non teaching | 1.54 (1.14-2.09) | 1.04 (0.73-1.48) | 1.21 (0.83-1.77) | 1.28 (0.83-1.99) | 1.35 (1.1-1.66) | 1.47 (1-2.18) | 1.12 (0.68-1.84) | 2.31 (1.32-4.03) |
| Urban teaching | 1.36 (1.02-1.82) | 2.25 (1.72-2.95) | 1.37 (0.96-1.96) | 2.32 (1.58-3.39) | 1.25 (1.04-1.5) | 3.58 (2.71-4.72) | 1.14 (0.72-1.82) | 5.36 (3.26-8.8) |
DAMA=Discharged Against Medical Advice
Discussion
Results of our study suggest that hospitalizations for both homicidal ideation and homicidal/assault victims in the US were low, but significant sociodemographic disparities exist with respect to age, race/ethnicity, and area income. Similar to previous studies, the highest prevalence of homicide ideation was among individuals less than 45 years of age. with the highest prevalence between the ages of 15 and 29 years of age.8 NH-Blacks aged 15- 29 years had the highest prevalence of homicidal ideation and hospitalization for homicide or assault, followed by Hispanics. In addition, after adjustment for sociodemographic and hospital characteristics, NH-Blacks and Hispanics aged 15-29 years had extremely high likelihood of experiencing homicide or assault. Previously published data in the US suggest that a significant increase in the odds of homicidal ideation among youth is associated with conduct disorders, attention deficit hyperactivity disorder and other behavioral and emotional disorders.9 Similar associations with social phobia and bullying have been reported in Peru and China.16,17 These psychiatric conditions could trigger aggressive behavior and inhibit self-control skills increasing risks for violent behavior. A study of 112 youths who were convicted of homicide in Missouri, found that the majority of youths had a history of aggressive behavior (76%) and previous contact with juvenile authorities (68%).A survey of middle and high school children in China found that the prevalence of homicidal ideation and violent behaviors increased with the number of childhood maltreatment types reported by a student.18 The data suggest that homicidal ideation could be a strong predictor of violent activity. However, additional research is needed to better understand the causal relationship between the two. Behavioral and emotional disorders are likely important factors but may not completely explain the high prevalence of homicidal and assault victimization observed in our analysis. Neurobiological risk factors including perinatal complications and neurocognitive deficits have been linked to youth violence,19 so has traumatic stress due to experiences such as neglect, abuse, family conflict, poverty and bullying.18,20-23 Chronic stress related to these types of experiences have been associated with changes in the development and functioning of the hypothalamic-pituitary-adrenocortical axis in ways that compromise adaptive responses to stress.23
Also consistent with previous studies, we found that homicidal ideation and homicide/assault victimizations were most common among patients in the lowest zipcode income quartile, regardless of race or ethnicity.8,21,24 These findings also support previous published data on premature mortality in the US that found education was a significant predictor of potential loss of life due to homicide while race/ethnicity was not.11 These results suggest that there are alternative circumstances other than previously established psychosocial factors (e.g. mental illness, history of abuse, poverty) that fuel violent crime among NH-Blacks in low income areas that have not been fully explored. A study of social determinants of health associated with firearm-related homicide in the US found that the incidents of homicide in a neighborhood increased with the percent of residents living in poverty and with the number of males living alone.25 These data point to socio-demographic characteristics other than race/ethnicity as important contributing factors. O'Flaherty et al. argue that a pre-emptive motive driven by a fear of being killed may also play a key role.26 In addition, it is possible that implicit bias in screening for homicidal ideation, as well as diagnosis and treatment of victims of violence exist among healthcare providers in these areas that may impact data reporting. Additional research is needed to better understand factors that cultivate violence in economically disadvantaged communities of color to effectively address the issue.
In our study Medicaid patients had the highest prevalence of homicidal ideation regardless of race or ethnicity and they were twice as likely to experience homicide or assault. These results are consistent with previous studies.8,9,24 Medicaid provides coverage to millions of eligible low- income adults and children. Given the prevalence of homicidal ideation and homicide/assaults among low-income patients in our study population, this finding is not surprising. Similarly, the prevalence of NH-Black patients who experienced violence was highest in urban teaching hospitals compared to other hospital settings. This is consistent with data that suggest that Blacks in urban high-density areas are more likely to be victims of violence than those living in suburban or rural areas.12,24
Further, our data showed an increasing trend in homicidal ideation from 2010 to 2017. The rate increase among NH-Blacks was the largest with a sharp rise between 2011 and 2012. However, the patterns for NH-Whites and Hispanics are similar. The reason for the dramatic rate increase is not clear but may coincide with the state of the economy during that time. In 2008, the US investment banking market collapsed which led to a recession. Increased stress and financial burden due to job loss could have resulted in an increase in depression and other mental health conditions associated with homicidal ideation. It is also possible that better screening and diagnosis of homicidal ideation improved the data reporting process.
This study has several strengths and limitations. The strengths of this study include a large sample size, the study design and time period of data collection. The HCUP NIS is designed to produce regional and national estimates of hospitalization utilization and outcomes. The analyses are conducted using weighted estimates that represent more than 35 million hospitalizations nationally. The large sample size allowed for the robust analysis of relatively rare conditions of a specific patient population at a regional and national level using a standardized dataset. Use of this data reduces selection bias and increases the precision of our statistical analyses. Further, our findings are based on data from 2010 to 2017 data, more recent and comprehensive than previous national studies which only include data up to 2016 and for a very limited number of years.9,24 Therefore, our results are more likely to accurately reflect recent prevalence data for homicidal ideation.
Limitations of this study include the source of the data. HCUP NIS is limited to an inpatient population and the information is presented at the hospitalization level rather than at the patient level. Homicide/assault diagnosis codes existed only for the year 2017 in the dataset. Therefore, temporal trends analysis was not possible. It is likely that a significant number of people with homicidal ideation or an injury due to assault may not present to a hospital unless their condition is considered to be severe enough to warrant serious medical treatment. It is also possible that an individual who presents to the hospital with a complaint not related to their behavioral health or mental illness will not be screened for homicidal ideation. Therefore, patients included in the HCUP NIS may be more likely to suffer from underlying mental illness or have a serious aggravated assault- related injury than people in the general population.
Further, we were unable to account for sociodemographic characteristics such as education level, employment, and marital status. In addition, we were not able to account for other factors known to be associated with homicidal ideation and violent behavior such as history of mental illness, history of violent behavior, childhood history of sexual or physical abuse, drug addiction, history self-harm and domestic partner violence. These data elements were not available in the HCUP NIS but are likely to influence the occurrence of homicidal ideation or victimization by homicide or assault.18,20,22,27,28
In addition, in this study we examined the occurrence of homicide and assault together because of the way ICD-9 and ICD-10 codes are designed. However, racial disparity of aggravated assault and other socio-demographic characteristics may not resemble that of murder. A report from the US Bureau of Justice Statistics 2018 National Criminal Victimization Survey suggests that rate for aggravated assault is 1.2 times higher among Blacks (10.0) compared to Whites (8.2).29 According to recent data from the CDC, the homicide rate for Blacks (22.8) is 7.9 times higher than that for Whites (2.9). These data suggest that the racial disparity gap for homicide among Blacks and Whites is much larger than that for aggravated assault in the US and should be separated, if possible.
Lastly, given the design of our study, we are unable to determine a causal relationship between homicidal ideation and actual perpetration of violent act. However, results of our study suggest that in specific groups where there is a high prevalence of homicidal ideation, there is also a high prevalence of victimization of homicide and other violent acts. We also suggest a plausible connection between homicidal ideation and aggressive behavior that can lead to violent activity. Our study underscores the need for additional research that evaluates homicidal ideation as a risk factor for violent crime.
Conclusion and Implications for Translation
We observed that NH-Black patients were more likely to have homicidal ideations and be victims of homicide. The results of this study emphasize the need to better implement public health interventions and clinical protocols that screen and address behavioral and mental health issues starting at the grade school level, especially for economically disadvantaged Black youth. Finally, this study highlights the importance of screening and diagnosis of homicidal ideation and mental illnesses in the hospital and urgent care setting in order to identify and facilitate treatment.
Compliance With Ethical Standards
Conflicts of Interest:
None.
Financial Disclosure:
None.
Ethics Approval:
The Baylor College of Medicine Institutional Review Board approved this study as exempt
Disclaimer:
None
Acknowledgments:
None.
Funding/Support:
Research funding support was provided by the US Department of Health and Human Services and Health Resources and Services Administration for Baylor College of Medicine Center of Excellence in Health Equity, Training, and Research (Grant No: D34HP31024).
References
- Homicidio mata mais pessoas do que conflitos armados, diz novo Estudo do UNODC. (accessed )
- FastStats- Homicide. Published 2019 (accessed )
- Data Finder - Health, United States - Products. Published August 9, 2018 (accessed )
- 1950-1964. Homicide in the United States. Published 2021 (accessed )
- Homicide Trends in the United States, 1980-2008. Published 2021 (accessed )
- Bureau of Justice Statistics Homicide Trends in the United States. Published 2021 (accessed )
- [Google Scholar]
- From the CDC-Leading Causes of Death-Non-Hispanic Black Males 2017. (accessed )
- Homicidal ideation and forensic psychopathology: Evidence from the 2016 nationwide emergency department sample (NEDS) J Forensic Sci. 2020;65(1):154-159.
- [CrossRef] [PubMed] [Google Scholar]
- Homicidal ideation among children and adolescents: Evidence from the 2012-2016 nationwide emergency department sample. J Pediatr. 2020;219:216-222.
- [CrossRef] [PubMed] [Google Scholar]
- Is involvement in school bullying associated with increased risk of murderous ideation and behaviours among adolescent students in China? BMC Psychiatry. 2019;19(1)
- [CrossRef] [PubMed] [Google Scholar]
- Education, Race/ethnicity, and causes of premature mortality among middle-aged adults in 4 us urban communities: Results from CARDIA, 1985-2017. Am J Public Health. 2020;110(4):530-536.
- [CrossRef] [PubMed] [Google Scholar]
- Fatal police shootings of civilians, by rurality. Prev Med. 2020;134:106046.
- [CrossRef] [PubMed] [Google Scholar]
- The impact of exposure to gun violence fatality on mental health outcomes in four urban US settings. Soc. Sci Med. 2020;246:112587.
- [CrossRef] [PubMed] [Google Scholar]
- Statistical Methodology and Applications Branch, Surveillance Research Program, National Cancer Institute, Bethesda, MD.
- [Google Scholar]
- Homicidal/violent thoughts, suicidal ideation and violent behavior in adolescents with social phobia in Metropolitan Lima, Perú. Asia. Pac Psychiatry. 2014;6(3):252-8.
- [CrossRef] [PubMed] [Google Scholar]
- Is involvement in school bullying s tudents in China? BMC Psychiatry. 2019;19(1):121.
- [CrossRef] [PubMed] [PubMed Central] [Google Scholar]
- Is childhood maltreatment associated with murderous ideation and behaviors in adolescents in China? Psychiatry Res. 2018;270:467-473.
- [CrossRef] [PubMed] [Google Scholar]
- Neurocriminology: Implications for the punishment, prediction and prevention of criminal behaviour. Nat Rev Neurosci. 2014;15(1):54-63.
- [CrossRef] [PubMed] [Google Scholar]
- Analysis of 112 juveniles who committed homicide: Characteristics and a closer look at family abuse. J Fam Violence. 1998;13(4):365-375.
- [CrossRef] [Google Scholar]
- Youth violence: what we know and what we need to know. Am Psychol. 2016;71(1):17-39.
- [CrossRef] [PubMed] [Google Scholar]
- Neurobiology of female homicide perpetrators. J Interpers Violence 2019 886260519860078
- [CrossRef] [PubMed] [Google Scholar]
- Effects of stress throughout the lifespan on the brain, behaviour and cognition. Nat Rev Neurosci. 2009;10(6):434-445.
- [CrossRef] [PubMed] [Google Scholar]
- Bureau of Justice Statistics Special Report: Black Victims of Violent Crime. US Dept. of Justice: Office of Justice Program; 2007. p. :1-12. (accessed )
- Social determinants of health in relation to firearm-related homicides in the United States: A nationwide multilevel cross-sectional study. PLoS Med. 2019;16(12):e1002978.
- [CrossRef] [PubMed] [Google Scholar]
- Homicidal behaviors among psychiatric outpatients. Hosp Community Psychiatry. 1994;45(2):127-132.
- [CrossRef] [PubMed] [Google Scholar]
- Exposure to genocide as a risk factor for homicide perpetration in rwanda: A population-based case- control study. J. Interpers Violence. 2018;33(12):1855-1870.
- [CrossRef] [PubMed] [Google Scholar]
- National Crime Victimization Survey (NCVS). Published 2013 (accessed )