Translate this page into:
Increasing Trends in Physical and Mental Health Problems among US Workers in Different Job Sectors During the COVID-19 Pandemic
✉Corresponding author email: gsingh@mchandaids.org
Abstract
Background:
The COVID-19 pandemic has had a substantial adverse impact on workers' employment and physical and mental health. However, job losses, job-related household income shocks, and their related physical and mental health problems have not been well-documented. Using temporal, nationally representative data, this study examines inequalities in job-related income losses and their resultant health impact among US workers aged 18-64 years in different job sectors during the pandemic.
Methods:
Using April, August, and December 2020 rounds of the US Census Bureau's Household Pulse Survey (N=56,156, 82,173, and 51,500), job-related income losses among workers in various job sectors and associated impacts on self-assessed health, depression, anxiety, worry, and lack of interest were analyzed by multivariable logistic regression.
Results:
In December 2020, 64.0% of self-employed and 66.3% of unemployed adults reported that they or someone in their household experienced a loss of employment income since the start of the pandemic in March 2020. This percentage was the lowest for the public sector (35.2%) and non-profit-sector (45.0%) workers. Job/income losses increased by 26% between April and December for workers in the private and non-profit sectors. Prevalence of fair/poor overall health, serious depression, serious anxiety, serious worry, and serious lack of interest increased substantially during the pandemic for workers in all sectors, with the self-employed, those in the family business, and the unemployed experiencing the highest risk and those in the government/public and non-profit sectors experiencing the lowest risk of poor physical and mental health. Workers in all sectors reporting job-related income losses experienced approximately 2-to-4-fold higher odds of poor overall health, serious depression, serious anxiety, serious worry, and serious lack of interest, compared to public-sector workers with no job/income losses, controlling for covariates.
Conclusion and Implications for Translation:
Job-related income losses and prevalence of poor overall health and mental health among workers in all sectors increased markedly during the pandemic, with the self- employed, family business, and unemployed workers being especially vulnerable to poor health, depression, anxiety, and stress.
Keywords
COVID-19
Pandemic
Job Sector
Job and Income Loss
Self-Assessed Health
Mental Health
Disparities

Introduction
The coronavirus disease (COVID-19) pandemic has had a huge impact on the United States (US) and global economy for over a year, causing widespread social and economic disruptions, massive job losses, and declines in the national gross domestic product (GDP) and economic growth.1-4 The pandemic has also led to increased social isolation, stress, physical and mental health problems, and a decline in overall well-being among all strata of the society.1-8 Impact of the pandemic has been particularly felt by the working-age population that has seen a significant rise in unemployment, job-related income losses, financial difficulties, food insecurity, and mental health problems.3,6,7
According to recent research, 42% of US adults reported household job or employment-related income loss during the early stages of the pandemic, with rates of symptoms of anxiety and/or depressive orders among US adults increasing sharply from 11% during January-June 2019 (the pre-pandemic level) to 41% in January 2021.7,9,10 Despite the evidence of substantial increases in unemployment, economic losses, and psychological distress levels among most population groups, the extent to which US workers in different job sectors have experienced job losses, household income shocks, and related physical and mental health problems over the course ofthe pandemic are not well documented. Although increased risks of job/income losses and adverse impact on physical and mental health have been analyzed for racial/ethnic and socioeconomic groups,6,7,10 an account of such experiences among workers in different job sectors has received little attention.
Using a large temporal and nationally representative survey, this study aims to examine disparities in job-related income losses (due to job loss, temporary layoffs and furloughs, reduced work hours, and pay cuts) among workers aged 18-64 years employed in different job sectors and the associated physical and mental health impact during the coronavirus pandemic.
The COVID-19 pandemic has widened health and healthcare inequalities in the US as socially disadvantaged and underserved populations have experienced disproportionately higher rates of disease, mortality, and health risks.11-14 Reducing health inequalities remains one of the most important goals of the Healthy People initiative and the US Department of Health and Human Services,15-17 and our study's aim of addressing inequalities in job/ income losses due to COVID-19 and resultant health impact by job sector is consistent with this goal. The study's aim is also in tandem with the US Presidential Executive Orders on COVID-19 that emphasize (1) addressing factors that have contributed to disparities in COVID-19 outcomes, and (2) developing evidence-based research and equitable public health response for mitigating the health inequities caused or exacerbated by the COVID-19 pandemic and for preventing such inequities in the future.18-20
Methods
Data
We used data from the April, August, and December 2020 rounds of the US Census Bureau's Household Pulse Survey (HPS).21 The HPS is a national sample household survey in which data on socioeconomic, demographic, self-assessed health, mental health, and healthcare characteristics during the COVID-19 pandemic are collected in near real-time via email and internet. All information collected in the survey are based on self-reports. The HPS uses a systematic sample design and is representative of the civilian non-institutionalized population of the United States.
The HPS was developed as a rapid response survey in order to track the social and economic impacts of the COVID-19 pandemic on American households on a weekly or a bi-weekly basis in partnership with seven US federal statistical agencies, namely: Bureau of Labor Statistics, National Center for Health Statistics, United States Department of Agriculture's Economic Research Service, National Center for Education Statistics, Department of Housing and Urban Development, Social Security Administration, Bureau of Transportation Statistics.22,23
Measurement of Job-Related Income Loss, Health Outcomes, Job Sector, and Covariates
To examine temporal trends, we selected independent HPS samples for April (Phase 1, Week 1), August (Phase 2, Week 13), and December (Phase 3, Week 21). We restricted the study sample to those aged 18-64 years given our primary aim of examining inequalities in job losses and resultant health impact by job sector. The seven binary outcome variables were job-related income loss, expected job/income loss, and five health measures: self-assessed fair/poor health, serious depression, serious anxiety, serious worry, and serious lack of interest. Job-related income loss was based on the question: "Have you, or has anyone in your household experienced a loss of employment income since March 13, 2020?” Expected household job loss was based on the question, "Do you expect that you or anyone in your household will experience a loss of employment income in the next four weeks because of the coronavirus pandemic?”
Self-assessed general health status was based on the question, "Would you say your health in general, is excellent, very good, good, fair, or poor?” The binary health status was defined with two categories: fair/ poor health vs. excellent/very good/good health. The depression variable was derived from the question, "Over the last seven days, how often have you been bothered by... feeling down, depressed, or hopeless? Would you say not at all, several days, more than half the days, or nearly every day?” Respondents who reported feeling down, depressed, or hopeless nearly every day of the past week were defined as having serious depression. The “anxiety” variable was derived from the question, "Over the last seven days, how often have you been bothered by the following problems... Feeling nervous, anxious, or on edge? Would you say not at all, several days, more than half the days, or nearly every day?” Respondents who reported feeling nervous, anxious, or on edge nearly every day of the past week were defined as having serious anxiety. The “worry” variable was derived from the question, "Over the last seven days, how often have you been bothered by the following problems... Not being able to stop or control worrying? Would you say not at all, several days, more than half the days, or nearly every day?” Respondents who reported not being able to stop or control worrying nearly every day of the past week were defined as having serious worry. The “lack of interest” variable was derived from the question, "Over the last seven days, how often have you been bothered by the following problems... having little interest or pleasure in doing things? Would you say not at all, several days, more than half the days, or nearly every day?” Respondents who reported having little interest or pleasure in doing things nearly every day of the past week were defined as having a serious lack of interest.
The sample size for the December 2020 HPS was 69,944 for all ages and 52,441 for the 18-64 age group. There were 941 (1.79%) observations with missing data for job sector and job-loss variables, excluding which resulted in an effective sample size of 51,500 for analysis. The sample size for all ages, for the 18-64 age group, and effective sample size for analysis were 109,051, 83,643, and 82,173 for the August HPS and 74,413, 57,086, and 56,156 for the April HPS, respectively.
The primary independent variable of interest was the job sector which consisted of 6 categories: government, private company, non-profit organization including tax-exempt and charitable organizations, self-employed, working in a family business, and unemployed. Based on the social determinants of health framework and previous research, the following covariates of job loss, self-assessed health, and mental health were considered: age, gender, race/ethnicity, marital status, region of residence, educational attainment, household income, housing tenure, and actual or expected job loss (for health outcomes only).16,24 Age was categorized into 5 groups: 18-24, 25-34, 35-44, 45-54, and 55-64. Race/ethnicity consisted of non-Hispanic Whites, non- Hispanic Blacks, Asians, the other/multiple-race group, and Hispanics. The other/multiple-race group consisted of American Indians and Alaska Natives (AIANs), Native Hawaiians and Pacific Islanders, and mixed-race individuals. Marital status was grouped into currently married, widowed, divorced/ separated, and never married. Education consisted of 5 groups: <high school, high school, some college, bachelor's degree, and master's degree or higher. Household income was measured as of 2019 and included 9 categories: <$25,000; $25,000-$34,999; $35,000-$49,999; $50,000-$74,999; $75,000-$99,999; $100,000-$ 149,999; $150,000-$ 199,999; $200,000+; and missing. Housing tenure consisted of homeowners and renters. Region of residence included Northeast, Midwest, South, and West.
Statistical Methods
Multivariable logistic regression was used to examine inequalities in actual job-related income losses since the start of the pandemic and expected job/income losses in the four weeks post-survey. Logic regression was also used to model inequalities in self-assessed health and four mental health measures by job sector in each time period after controlling for selected socioeconomic and demographic characteristics. The Chi-square statistic was used to test the overall association between the job sector and prevalence of job-related income losses and 5 health measures, whereas the two-sample t-test was used to test the difference in prevalence between any two groups or time periods. To account for the complex sample design of the HPS, SUDAAN software was used to conduct all statistical analyses, including the logistic modeling procedure RLOGIST.25
Results
Trends and Disparities in Job-Related income Losses Due to the Pandemic by Job Sector
In December, 51.3% of private-sector workers, 64.0% of self-employed workers, and 66.3% of unemployed adults reported that they or someone in their household experienced a loss of employment income since the start of the pandemic in March 2020 (Table 1 and Figure 1). This percentage was the lowest among those working in the public sector (35.2%) and the non-profit sector (45.0%). For workers in the private and non-profit sectors, household job/income losses increased by 26% between April 2020 and December 2020 (Figure 1).
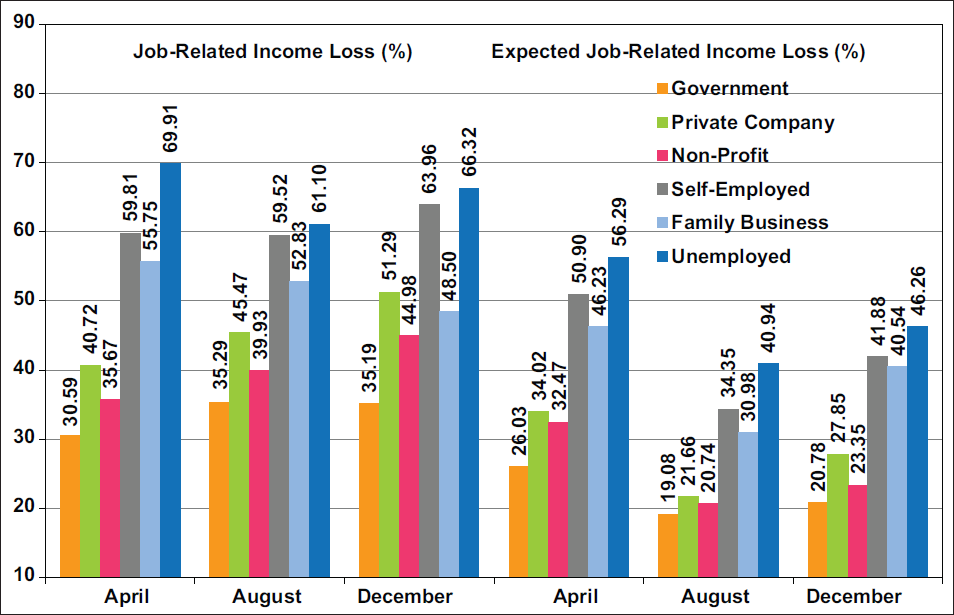
- Increases in Job-Related Income Losses Since the Pandemic and Expected Job/Income Losses in the Next Four Weeks among Adults Aged 18-64 Years by Job Sector, United States, April, August, and December 2020
-
Source: Data derived from April, August, and December 2020 Household Pulse Survey. Notes: Chi-square statistics for testing the overall association between job sector and job losses were statistically significant at P<0.001 for each time period. Increases or changes in job losses by job sector between April and December were statistically significant at P<0.05.
| Job sector | Unadjusted | Unadjusted Model 11 | Adjusted Model 22 | Adjusted2 | ||||||
|---|---|---|---|---|---|---|---|---|---|---|
| Prevalence | SE | OR | 95% CI | AOR | 95% CI | Prevalence | SE | |||
| Job loss3 | ||||||||||
| Job sector | ||||||||||
| All sectors | 55.41 | 0.46 | ||||||||
| Government | 35.19 | 1.27 | 1.00 | reference | 1.00 | reference | 37.79 | 1.35 | ||
| Private company | 51.29 | 0.72 | 1.94 | 1.71 | 2.19 | 1.84 | 1.62 | 2.09 | 52.14 | 0.72 |
| Non-profit | 44.98 | 1.53 | 1.51 | 1.28 | 1.77 | 1.59 | 1.35 | 1.87 | 48.62 | 1.55 |
| Self-employed | 63.96 | 1.52 | 3.27 | 2.76 | 3.87 | 3.23 | 2.71 | 3.84 | 65.04 | 1.47 |
| Family business | 48.50 | 4.22 | 1.73 | 1.22 | 2.46 | 1.45 | 1.01 | 2.09 | 46.48 | 4.17 |
| Unemployed | 66.32 | 0.77 | 3.63 | 3.19 | 4.12 | 3.07 | 2.69 | 3.51 | 63.98 | 0.76 |
| Expected Job loss4 | ||||||||||
| Job sector | ||||||||||
| All sectors | 34.57 | 0.47 | ||||||||
| Government | 20.78 | 1.18 | 1.00 | reference | 1.00 | reference | 23.59 | 1.33 | ||
| Private company | 27.85 | 0.71 | 1.47 | 1.26 | 1.72 | 1.36 | 1.16 | 1.61 | 29.27 | 0.73 |
| Non-profit | 23.35 | 1.39 | 1.16 | 0.94 | 1.43 | 1.26 | 1.02 | 1.56 | 27.72 | 1.55 |
| Self-employed | 41.88 | 1.68 | 2.75 | 2.26 | 3.34 | 2.56 | 2.08 | 3.14 | 42.75 | 1.67 |
| Family business | 40.54 | 4.41 | 2.60 | 1.77 | 3.82 | 2.05 | 1.40 | 3.02 | 37.83 | 3.99 |
| Unemployed | 46.26 | 0.85 | 3.28 | 2.81 | 3.83 | 2.52 | 2.13 | 2.97 | 42.37 | 0.80 |
SE= standard error OR=odds ratio; AOR=adjusted odds ratio; CI=confidence interval. 1Unadjusted for the effects of other covariates. 2This logistic regression model includes age, gender race/ethnicity, marital status, region of residence, education, household income, housing tenure, and job sector as covariates. 3Loss of employment or related income since March 13, 2020. 4Expect losing job or related income in the next four weeks due to pandemic. Chi-square tests for differences in unadjusted and adjusted prevalence of job losses by job sector were statistically significant at P<0.001
Compared with the government-sector workers, self-employed, unemployed, private sector, non-profit sector, or family business workers had, respectively, 223%, 207%, 84%, 59%, and 45% higher adjusted odds of experiencing job/income losses (Table 1). Disparities in prevalence and adjusted odds of expected job/income losses according to job sector were similar to those in actual job/income losses (Table 1 and Figure 1).
Trends and Disparities in Physical and Mental Health Problems During the Pandemic by Job Sector
Between April and December 2020, the prevalence increased by 42.8% for fair/poor health; 55.3% for serious depression; 33.6% for serious anxiety; 42.1% for serious worry; and 55.1% for serious lack of interest across all job sectors (Table 2). Unemployed adults and workers in each sector reported marked increases in poor overall health and serious mental health problems during April-December 2020. In December 2020, the prevalence of fair/poor health ranged from 12.3% for workers in the non-profit sector and 14.7% in the government sector to 17.1% for those in the family business, 17.9% for the self- employed, and 33.6% for unemployed adults (Table 2). Controlling for covariates, the odds of reporting fair/ poor health were 74% higher for the unemployed than government-sector workers (Table 2).
| Job sector | Unadjusted | Unadjusted Model 11 | Adjusted Model 22 | Adjusted2 | % Increase in Unadj. Prevalence | |||||||
|---|---|---|---|---|---|---|---|---|---|---|---|---|
| Prevalence | SE | OR | 95% CI | AOR | 95% CI | Prevalence | SE | Apr-Dec | Aug-Dec | |||
| Self-Assessed Fair/Poor Health | ||||||||||||
| All sectors | 21.52 | 0.44 | 42.80 | 21.58 | ||||||||
| Government | 14.65 | 0.99 | 1.00 | reference | 1.00 | reference | 18.82 | 1.20 | 87.58 | 24.89 | ||
| Private company | 15.34 | 0.58 | 1.06 | 0.88 | 1.26 | 0.91 | 0.76 | 1.10 | 17.56 | 0.66 | 36.48 | 18.82 |
| Non-profit | 12.26 | 1.00 | 0.81 | 0.64 | 1.03 | 0.83 | 0.64 | 1.07 | 16.32 | 1.32 | 42.06 | 12.68* |
| Self-employed | 17.89 | 1.91 | 1.27 | 0.94 | 1.71 | 0.91 | 0.68 | 1.21 | 17.48 | 1.63 | 67.20 | 39.11 |
| Family business | 17.13 | 3.85 | 1.20 | 0.69 | 2.09 | 0.77 | 0.43 | 1.36 | 15.32 | 3.39 | 72.16 | 3.82* |
| Unemployed | 33.63 | 0.86 | 2.95 | 2.48 | 3.50 | 1.74 | 1.45 | 2.09 | 27.71 | 0.73 | 49.47 | 19.21 |
| Serious Depression | ||||||||||||
| All sectors | 15.82 | 0.39 | 55.25 | 36.73 | ||||||||
| Government | 9.49 | 0.80 | 1.00 | reference | 1.00 | reference | 11.11 | 0.92 | 62.22 | 15.03* | ||
| Private company | 12.63 | 0.53 | 1.38 | 1.12 | 1.69 | 1.20 | 0.97 | 1.48 | 12.94 | 0.55 | 60.69 | 30.07 |
| Non-profit | 10.25 | 0.91 | 1.09 | 0.83 | 1.42 | 1.12 | 0.85 | 1.47 | 12.21 | 1.09 | 34.16 | 13.01* |
| Self-employed | 14.61 | 1.45 | 1.63 | 1.22 | 2.18 | 1.45 | 1.09 | 1.93 | 15.13 | 1.40 | 53.47 | 46.25 |
| Family business | 15.34 | 2.69 | 1.73 | 1.11 | 2.69 | 1.30 | 0.83 | 2.05 | 13.87 | 2.41 | 74.52 | 66.74 |
| Unemployed | 22.79 | 0.82 | 2.81 | 2.30 | 3.45 | 2.18 | 1.77 | 2.69 | 20.86 | 0.74 | 61.63 | 41.55 |
| Serious Anxiety | ||||||||||||
| All sectors | 24.32 | 0.44 | 33.63 | 24.14 | ||||||||
| Government | 18.52 | 1.00 | 1.00 | reference | 1.00 | reference | 19.70 | 1.08 | 37.19 | 13.41* | ||
| Private company | 21.84 | 0.66 | 1.23 | 1.06 | 1.43 | 1.16 | 0.99 | 1.35 | 22.06 | 0.69 | 36.67 | 26.76 |
| Non-profit | 21.13 | 1.19 | 1.18 | 0.97 | 1.43 | 1.15 | 0.95 | 1.40 | 21.92 | 1.25 | 20.95 | 7.97* |
| Self-employed | 22.70 | 1.54 | 1.29 | 1.04 | 1.60 | 1.25 | 1.01 | 1.55 | 23.32 | 1.53 | 16.05 | 23.71 |
| Family business | 23.81 | 3.23 | 1.37 | 0.95 | 1.99 | 1.20 | 0.83 | 1.74 | 22.66 | 2.97 | 66.62 | 36.76 |
| Unemployed | 29.91 | 0.84 | 1.88 | 1.61 | 2.18 | 1.69 | 1.44 | 1.98 | 28.90 | 0.80 | 38.02 | 23.60 |
| Serious Worry | ||||||||||||
| All sectors | 18.09 | 0.41 | 42.11 | 28.85 | ||||||||
| Government | 12.42 | 0.89 | 1.00 | reference | 1.00 | reference | 13.86 | 0.99 | 62.35 | 22.00 | ||
| Private company | 15.25 | 0.59 | 1.27 | 1.06 | 1.52 | 1.16 | 0.96 | 1.40 | 15.69 | 0.62 | 42.12 | 29.35 |
| Non-profit | 14.51 | 1.46 | 1.20 | 0.90 | 1.58 | 1.22 | 0.91 | 1.63 | 16.32 | 1.69 | 50.52 | 9.34* |
| Self-employed | 14.54 | 1.22 | 1.20 | 0.94 | 1.54 | 1.10 | 0.85 | 1.42 | 15.00 | 1.24 | 7.07* | 14.49* |
| Family business | 19.11 | 2.97 | 1.67 | 1.11 | 2.51 | 1.36 | 0.90 | 2.07 | 17.86 | 2.76 | 107.49 | 46.55 |
| Unemployed | 24.47 | 0.81 | 2.29 | 1.91 | 2.74 | 1.86 | 1.54 | 2.24 | 22.68 | 0.75 | 49.30 | 31.21 |
| Serious Lack of Interest | ||||||||||||
| All sectors | 15.34 | 0.39 | 55.11 | 41.38 | ||||||||
| Government | 10.84 | 1.14 | 1.00 | reference | 1.00 | reference | 12.59 | 1.28 | 84.35 | 44.92 | ||
| Private company | 12.33 | 0.55 | 1.16 | 0.90 | 1.49 | 0.99 | 0.77 | 1.27 | 12.46 | 0.56 | 57.67 | 34.02 |
| Non-profit | 10.29 | 0.99 | 0.94 | 0.69 | 1.29 | 0.95 | 0.70 | 1.30 | 12.09 | 1.16 | 46.16 | 24.43 |
| Self-employed | 13.62 | 1.38 | 1.30 | 0.94 | 1.80 | 1.15 | 0.84 | 1.59 | 14.21 | 1.37 | 48.37 | 42.02 |
| Family business | 19.24 | 3.71 | 1.96 | 1.16 | 3.30 | 1.53 | 0.88 | 2.64 | 17.83 | 3.58 | 171.37 | 175.64 |
| Unemployed | 21.33 | 0.76 | 2.23 | 1.74 | 2.85 | 1.74 | 1.36 | 2.23 | 19.75 | 0.70 | 57.07 | 40.98 |
SE= standard error OR=odds ratio; AOR=adjusted odds ratio; CI=confidence interval. 1Unadjusted for the effects of other covariates. 2Adjusted by logistic regression for age, gender race/ethnicity, marital status, region of residence, education, household income, and housing tenure as covariates. All Chi-square tests for differences in the unadjusted and adjusted prevalence of fair/poor health, serious depression, serious anxiety serious worry, and serious lack of interest by job sector were statistically significant at P<0.001. *Not significantly different from zero at P<0.05. All other percent changes were statistically significant at P<0.05
Prevalence of serious depression varied from a low of 9.5% for workers in the government sector and 10.3% for workers in the non-profit sector to a high of 14.6% for the self-employed, 15.3% for those in the family business, and 22.8% for unemployed adults. Controlling for covariates, the odds of serious depression were 45% higher for the self-employed and 118% higher for the unemployed, compared to government-sector workers (Table 2). Prevalence and odds of serious anxiety, serious worry, and serious lack of interest were generally lowest among workers in the government and non-profit sectors and highest among the self-employed, those in the family business, and the unemployed (Table 2).
impact of Household Job/income Losses on Physical and Mental Health Problems by Job Sector During the Pandemic
In each sector, workers with job/income losses had substantially higher risks of poor physical and mental health than their counterparts with no job/ income losses (Table 3). In December, the prevalence of fair/poor health varied from 7.0% for the self- employed and 9.3% for workers in the non-profit sector without job/income losses to 23.7% for the self-employed with job/income losses and 34.8% for unemployed adults with job/income losses (Table 3).
| Covariates | Unadjusted | Unadjusted Model 11 | Adjusted Model 22 | Adjusted2 | ||||||
|---|---|---|---|---|---|---|---|---|---|---|
| Prevalence | SE | OR | 95% | CI | AOR | 95% | CI | Prevalence | SE | |
| Self-Assessed Fair/Poor Health | ||||||||||
| Job-related income loss × Job sector | ||||||||||
| Government, Job/Income Loss | 22.23 | 2.10 | 2.45 | 1.79 | 3.35 | 2.08 | 1.50 | 2.87 | 24.95 | 2.20 |
| Government, No Job/Income Loss | 10.45 | 0.97 | 1.00 | reference | 1.00 | reference | 14.46 | 1.27 | ||
| Private Company, Job/Income Loss | 19.75 | 0.95 | 2.11 | 1.67 | 2.66 | 1.56 | 1.23 | 2.00 | 20.40 | 0.96 |
| Private Company, No Job Loss | 10.81 | 0.66 | 1.04 | 0.81 | 1.32 | 0.95 | 0.74 | 1.22 | 13.90 | 0.84 |
| Non-profit, Job/Income Loss | 16.14 | 1.73 | 1.65 | 1.19 | 2.27 | 1.32 | 0.93 | 1.87 | 17.98 | 1.97 |
| Non-profit, No Job/Income Loss | 9.03 | 1.18 | 0.85 | 0.60 | 1.20 | 0.97 | 0.69 | 1.38 | 14.14 | 1.68 |
| Self-employed, Job/Income Loss | 23.65 | 2.71 | 2.65 | 1.86 | 3.79 | 1.65 | 1.17 | 2.34 | 21.26 | 2.17 |
| Self-employed, No Job/Income Loss | 7.03 | 1.14 | 0.65 | 0.44 | 0.96 | 0.53 | 0.35 | 0.81 | 8.52 | 1.39 |
| Family business, Job/Income Loss | 21.98 | 6.31 | 2.41 | 1.14 | 5.10 | 1.29 | 0.59 | 2.80 | 17.67 | 5.15 |
| Family business, No Job/Income Loss | 11.51 | 3.41 | 1.11 | 0.56 | 2.21 | 0.81 | 0.37 | 1.75 | 12.18 | 3.81 |
| Unemployed, Job/Income Loss | 34.80 | 1.09 | 4.57 | 3.66 | 5.72 | 2.53 | 2.01 | 3.20 | 28.47 | 0.91 |
| Unemployed, No Job/Income Loss | 31.22 | 1.40 | 3.89 | 3.06 | 4.94 | 2.28 | 1.78 | 2.93 | 26.59 | 1.18 |
| Serious Depression | ||||||||||
| Job-related income loss × Job sector | ||||||||||
| Government, Job/Income Loss | 14.09 | 1.69 | 2.20 | 1.52 | 3.17 | 1.96 | 1.35 | 2.84 | 15.05 | 1.75 |
| Government, No Job/Income Loss | 6.95 | 0.80 | 1.00 | reference | 1.00 | reference | 8.45 | 0.98 | ||
| Private Company, Job/Income Loss | 17.08 | 0.89 | 2.76 | 2.10 | 3.63 | 2.16 | 1.63 | 2.86 | 16.28 | 0.84 |
| Private Company, No Job Loss | 8.05 | 0.54 | 1.17 | 0.88 | 1.56 | 1.06 | 0.80 | 1.42 | 8.93 | 0.62 |
| Non-profit, Job/Income Loss | 14.01 | 1.81 | 2.18 | 1.49 | 3.19 | 1.99 | 1.35 | 2.93 | 15.24 | 1.90 |
| Non-profit, No Job/Income Loss | 7.12 | 0.72 | 1.03 | 0.74 | 1.42 | 1.07 | 0.77 | 1.50 | 8.98 | 0.94 |
| Self-employed, Job/Income Loss | 17.67 | 2.00 | 2.87 | 2.00 | 4.13 | 2.36 | 1.64 | 3.38 | 17.47 | 1.85 |
| Self-employed, No Job/Income Loss | 8.86 | 1.76 | 1.30 | 0.80 | 2.13 | 1.22 | 0.75 | 1.98 | 10.07 | 1.88 |
| Family business, Job/Income Loss | 18.46 | 3.95 | 3.03 | 1.72 | 5.35 | 2.09 | 1.15 | 3.80 | 15.86 | 3.53 |
| Family business, No Job/Income Loss | 11.72 | 3.67 | 1.78 | 0.85 | 3.71 | 1.44 | 0.71 | 2.92 | 11.64 | 3.35 |
| Unemployed, Job/Income Loss | 26.93 | 1.07 | 4.93 | 3.78 | 6.44 | 3.62 | 2.75 | 4.78 | 24.17 | 0.97 |
| Unemployed, No Job/Income Loss | 14.55 | 1.12 | 2.28 | 1.69 | 3.08 | 1.85 | 1.36 | 2.51 | 14.37 | 1.07 |
| Serious Anxiety | ||||||||||
| Job-related income loss × Job sector | ||||||||||
| Government, Job/Income Loss | 24.60 | 1.98 | 1.83 | 1.40 | 2.39 | 1.71 | 1.30 | 2.25 | 24.75 | 1.98 |
| Government, No Job/Income Loss | 15.15 | 1.10 | 1.00 | reference | 1.00 | reference | 16.36 | 1.21 | ||
| Private Company, Job/Income Loss | 27.48 | 1.06 | 2.12 | 1.74 | 2.59 | 1.89 | 1.54 | 2.32 | 26.64 | 1.03 |
| Private Company, No Job Loss | 16.04 | 0.77 | 1.07 | 0.87 | 1.31 | 1.04 | 0.85 | 1.28 | 16.91 | 0.83 |
| Non-profit, Job/Income Loss | 25.55 | 2.23 | 1.92 | 1.44 | 2.55 | 1.80 | 1.35 | 2.39 | 25.67 | 2.13 |
| Non-profit, No Job/Income Loss | 17.45 | 1.20 | 1.18 | 0.94 | 1.5 | 1.13 | 0.89 | 1.44 | 18.06 | 1.28 |
| Self-employed, Job/Income Loss | 27.35 | 2.15 | 2.11 | 1.61 | 2.76 | 1.98 | 1.50 | 2.61 | 27.51 | 2.09 |
| Self-employed, No Job/Income Loss | 13.94 | 1.82 | 0.91 | 0.64 | 1.28 | 0.90 | 0.64 | 1.25 | 14.94 | 1.84 |
| Family business, Job/Income Loss | 27.53 | 4.82 | 2.13 | 1.29 | 3.52 | 1.77 | 1.07 | 2.92 | 25.38 | 4.38 |
| Family business, No Job/Income Loss | 19.52 | 4.30 | 1.36 | 0.77 | 2.38 | 1.27 | 0.74 | 2.18 | 19.79 | 4.02 |
| Unemployed, Job/Income Loss | 34.72 | 1.10 | 2.98 | 2.45 | 3.61 | 2.63 | 2.14 | 3.23 | 33.26 | 1.05 |
| Unemployed, No Job/Income Loss | 20.35 | 1.19 | 1.43 | 1.15 | 1.79 | 1.35 | 1.07 | 1.70 | 20.78 | 1.19 |
| Serious Worry | ||||||||||
| Job-related income loss × Job sector | ||||||||||
| Government, Job/Income Loss | 18.62 | 1.93 | 2.32 | 1.68 | 3.2 | 2.09 | 1.51 | 2.89 | 19.14 | 1.95 |
| Government, No Job/Income Loss | 8.99 | 0.85 | 1.00 | reference | 1.00 | reference | 10.33 | 0.98 | ||
| Private Company, Job/Income Loss | 20.76 | 1.00 | 2.65 | 2.1 | 3.36 | 2.22 | 1.75 | 2.83 | 20.10 | 0.96 |
| Private Company, No Job Loss | 9.60 | 0.59 | 1.07 | 0.84 | 1.37 | 1.02 | 0.80 | 1.31 | 10.55 | 0.66 |
| Non-profit, Job/Income Loss | 20.26 | 2.89 | 2.57 | 1.71 | 3.86 | 2.35 | 1.55 | 3.57 | 20.96 | 3.01 |
| Non-profit, No Job/Income Loss | 9.73 | 0.92 | 1.09 | 0.82 | 1.46 | 1.13 | 0.84 | 1.52 | 11.47 | 1.12 |
| Self-employed, Job/Income Loss | 17.00 | 1.64 | 2.07 | 1.53 | 2.81 | 1.78 | 1.31 | 2.44 | 16.88 | 1.63 |
| Self-employed, No Job/Income Loss | 9.93 | 1.73 | 1.12 | 0.73 | 1.72 | 1.07 | 0.71 | 1.62 | 10.97 | 1.77 |
| Family business, Job/Income Loss | 21.73 | 4.28 | 2.81 | 1.65 | 4.79 | 2.16 | 1.26 | 3.69 | 19.63 | 3.86 |
| Family business, No Job/Income Loss | 16.09 | 4.15 | 1.94 | 1.03 | 3.67 | 1.68 | 0.89 | 3.17 | 16.09 | 4.02 |
| Unemployed, Job/Income Loss | 29.30 | 1.08 | 4.20 | 3.34 | 5.27 | 3.28 | 2.60 | 4.14 | 26.83 | 0.99 |
| Unemployed, No Job/Income Loss | 14.87 | 1.02 | 1.77 | 1.37 | 2.29 | 1.51 | 1.16 | 1.97 | 14.70 | 1.01 |
| Serious Lack of Interest | ||||||||||
| Job-related income loss × Job sector | ||||||||||
| Government, Job/Income Loss | 19.10 | 2.71 | 3.53 | 2.33 | 5.35 | 3.13 | 2.09 | 4.69 | 20.10 | 2.62 |
| Government, No Job/Income Loss | 6.27 | 0.71 | 1.00 | reference | 1.00 | reference | 7.64 | 0.87 | ||
| Private Company, Job/Income Loss | 15.77 | 0.90 | 2.80 | 2.14 | 3.67 | 2.16 | 1.64 | 2.85 | 14.94 | 0.84 |
| Private Company, No Job Loss | 8.79 | 0.63 | 1.44 | 1.09 | 1.91 | 1.27 | 0.96 | 1.69 | 9.49 | 0.68 |
| Non-profit, Job/Income Loss | 12.92 | 1.73 | 2.22 | 1.51 | 3.25 | 2.01 | 1.36 | 2.96 | 14.06 | 1.82 |
| Non-profit, No Job/Income Loss | 8.10 | 1.13 | 1.32 | 0.9 | 1.93 | 1.34 | 0.92 | 1.96 | 9.95 | 1.35 |
| Self-employed, Job/Income Loss | 16.27 | 1.90 | 2.91 | 2.03 | 4.17 | 2.40 | 1.67 | 3.44 | 16.27 | 1.81 |
| Self-employed, No Job/Income Loss | 8.63 | 1.75 | 1.41 | 0.86 | 2.31 | 1.32 | 0.80 | 2.16 | 9.78 | 1.91 |
| Family business, Job/Income Loss | 25.62 | 5.95 | 5.15 | 2.67 | 9.91 | 3.71 | 1.80 | 7.65 | 22.88 | 5.91 |
| Family business, No Job/Income Loss | 11.84 | 3.70 | 2.01 | 0.96 | 4.18 | 1.63 | 0.80 | 3.36 | 11.81 | 3.51 |
| Unemployed, Job/Income Loss | 24.32 | 0.98 | 4.80 | 3.71 | 6.21 | 3.55 | 2.71 | 4.64 | 22.11 | 0.90 |
| Unemployed, No Job/Income Loss | 15.39 | 1.15 | 2.72 | 2.03 | 3.64 | 2.23 | 1.65 | 3.01 | 15.32 | 1.14 |
SE= standard error. OR=odds ratio; AOR=adjusted odds ratio; CI=confidence interval. 1Unadjusted for the effects of other covariates. 2Adjusted by logistic regression for age, gender race/ethnicity, marital status, region of residence, education, household income, and housing tenure. All Chi-square tests for differences in unadjusted and adjusted prevalence of fair/poor health, serious depression, serious anxiety, serious worry, and serious lack of interest by job sector × work/income loss were statistically significant at P<0.001
Compared to workers in the government sector with no job/income losses, workers in the private and government sectors, self-employed, and unemployed adults with job/income losses had 1.6 to 2.5 times higher adjusted odds of experiencing fair/poor health.
Prevalence of serious depression varied from 7.0% for workers in the government sector and 7.1% for workers in the non-profit sector without job/income losses to 18.5% for those in the family business with job/income losses and 26.9% for unemployed adults with job/income losses. Compared to workers in the government sector with no job/income losses, workers from all other sectors with job/income losses experienced 2.0 to 3.6 times higher odds of serious depression (Table 3). Patterns of disparities in serious anxiety, serious worry, and serious lack of interest by job sector and job/income losses were similar to those for poor self-assessed health and serious depression, with workers with no job/losses in each sector experiencing almost twice the risk of serious mental health problems than their counterparts with job/income losses (Table 3).
Discussion
In this study, we have analyzed trends in household job/income losses and resultant physical and mental health inequalities in the US by job sector, an important social determinant, over the 9-month course of the COVID-19 pandemic. Job-related income losses among workers in different job sectors have increased substantially since the start of the pandemic in March 2020. However, workers in certain sectors were particularly vulnerable to this economic hardship during the pandemic. Nearly two-thirds of self-employed and unemployed adults, and almost half of the workers in the private sector, family business, and the non-profit sector reported that they or someone in their household experienced a loss of employment income since the start of the pandemic in March 2020, compared with one-third of public-sector workers. This is not surprising given that small business owners, self-employed workers, and those working in the family business were particularly hit hard by business and store closures, drop-in business activity, and the overall economic fallout during the early stages of the pandemic.7,26,27
We found that the prevalence of poor overall health and serious depression, anxiety, worry, and lack of interest increased among workers in all sectors between April and December 2020. However, in each time period, private-sector, self-employed, family- business, and unemployed workers experienced the highest risk, and workers in the government/public and non-profit sectors experienced the lowest risk of poor physical and mental health. Differences in sociodemographic characteristics, including race/ethnicity and socioeconomic status, partly accounted for some of the health disparity by job sector; however, unemployed and self-employed workers maintained significantly higher risks of poor overall health, serious depression, and anxiety. The adverse health impacts of job/income losses were substantial. Even after controlling for sociodemographic characteristics, workers in all sectors reporting job-related income losses experienced 2-to-4-fold higher adjusted odds of poor overall health, serious depression, serious anxiety, serious worry, and serious lack of interest than public-sector workers with no job/income losses. Approximately 22-24% of self-employed, family-business, and government workers who experienced job/income losses during the pandemic reported being in poor overall health, 14-18% experienced serious depression, and 25- 28% experienced serious anxiety. These estimates of poor health and serious mental health problems are substantially greater than those reported for the general US population prior to the pandemic and consistent with estimated mental health impacts among the self-employed in the UK.9,28
Although estimates of the job and economic losses and physical and mental health status have been previously reported using the HPS,6,7 no US study, to our knowledge, had examined temporal inequalities in overall health and mental health outcomes by job sector during the course of the pandemic. Additionally, our study makes a new contribution to the COVID-19 literature by examining disparities in poor overall health, depression, anxiety, worry, and lack of interest among workers from different job sectors as a result of growing job and economic losses over the 9-month course of the pandemic.
The COVID-19 pandemic has affected ethnic- minority and socially disadvantaged groups in terms of increased mortality, incidence, and hospitalization,11-14 and the evidence presented here shows a similarly marked increase in poor physical health and mental health problems overall and those associated with job/income losses among US workers in different job sectors. Our findings show particularly elevated risks of poor health, serious depression, anxiety, and distress among workers and the unemployed during the pandemic and are consistent with previous research indicating substantially increased risks of adverse health and behavioral outcomes (such as all-cause mortality, reduced life expectancy, cardiovascular disease, poor self-assessed physical and mental health, suicide, smoking, heavy drinking, poor diet, physical inactivity, and reduced health care access) associated with unemployment and the related income loss.29-33
Limitations
This study has some limitations. HPS does not collect information on many factors that could help explain the rising prevalence of and disparities in physical and mental health problems among workers in various job sectors during the pandemic, including job insecurity, work-related stress, autonomy, control, and decision making in the workplace, social and physical isolation, lack of social support or connectedness, loss of self-identity and sense of control, unhealthy diet, lack of physical inactivity, smoking, alcohol, and other substance use.4,29 Nevertheless, the analysis of temporal data indirectly sheds light on the significance of these factors which are central to understanding how certain groups of workers have remained vulnerable to an increased likelihood of experiencing poor health and psychological distress as the pandemic has continued to disproportionately affect their social and economic well-being.
Second, the job-sector variable in HPS does not provide details about different industries such as agricultural, non-agricultural, manufacturing, construction, and service sectors, and types of public-sector workers such as federal, state, or local government employees, and armed forces. Third, HPS is a cross-sectional survey; causality cannot be inferred especially for the association of the job sector with self-assessed health and mental health. However, reverse causality is less of an issue, since employment in different job sectors is less likely to change during the course of the pandemic, and self- assessed health and mental health were measured at the time of or the week preceding the survey. Fourth, the respondents in HSP are more likely to be women and non-Hispanic Whites and have higher education, compared with the American Community Survey.34 This might have resulted in an underrepresentation of workers in more disadvantaged job sectors such as self-employment, family business, and the unemployed. However, we addressed disproportionate sampling of demographic characteristics by using survey weights, which rakes the demographics of the interviewed persons to education attainment/sex/age distributions and ethnicity/race/sex/age population distributions.22
Conclusion and Implications for Translation
Analysis of temporal, nationally representative census data revealed that job-related income losses and prevalence of poor overall health and mental health among workers in all sectors increased markedly during the pandemic, with self-employed, family business, and unemployed workers being especially vulnerable to poor health, depression, anxiety, and stress. Job/income losses increased by 26% between April and December for workers in the private and non-profit sectors. Prevalence of poor overall health and mental health problems nearly doubled among workers in the family business, and workers in the public sector experienced a doubling of the risk of poor health and a 62-84% rise in serious depression, serious worry, and lack of interest during the course of the pandemic.
Workers affected by mounting job and economic losses during the pandemic are in critical need of social and economic aid and would benefit from increased access and improved response to mental health and other social services. The American Rescue Plan Act of 2021 – a $1.9 trillion COVID relief package, provides extended unemployment benefits and tens of billions in aid for small businesses and not-for-profits.35,36 Our study findings emphasize the continuing need for monitoring changes in physical and mental health status and disruptions to mental health services among workers in various job sectors during the ongoing pandemic and promoting and expanding access to evidence-based primary and community-based health services, psychosocial support, and social care.4,37
Compliance with Ethical Standards
Conflicts of Interest:
The authors declare that they have no conflict of interest.
Financial Disclosure:
None to report.
Ethics Approval:
No IRB approval was required for this study, which is based on the secondary analysis of a public-use federal database.
Disclaimer:
The views expressed are the authors' and not necessarily those of their institutions.
Acknowledgment:
None.
Funding/Support:
None.
References
- Impact of COVID-19 on People's Livelihoods, Their Health and Our Food Systems. (accessed )
- The Impact of the COVID-19 Pandemic on Jobs and Incomes in G20 Economies. G20 Saudi Arabia 2020; (accessed )
- 2020. Policy Brief COVID-19 and the Need for Action on Mental Health. (accessed )
- Vital statistics rapid release: provisional life expectancy estimates for January through June, 2020. CDC Stacks. Published February 2021 (accessed )
- [CrossRef] [Google Scholar]
- Economic fallout from COVID-19 continues to hit lower-income Americans the hardest. Pew Research Center. Published September 24, 2020 (accessed )
- [Google Scholar]
- The implications of COVID-19 for mental health and substance use. Kaiser Family Foundation. Published February 10, 2021 (accessed )
- [Google Scholar]
- Years of life lost to COVID-19 in 81 countries. Sci. 2021. Rep. 11:3504.
- [CrossRef] [PubMed] [Google Scholar]
- 2020. Early Release of Selected Mental Health Estimates Based on Data from the January–June 2019 National Health Interview Survey. Hyattsville, MD: National Health Interview Survey Early Release Program; Hyattsville, MD: US Department of Health and Human Services; (accessed )
- US Census Bureau-assessed prevalence of anxiety and depressive symptoms in 2019 and during the 2020 COVID-19 pandemic. Depress Anxiety. 2020;37(10):954-956.
- [CrossRef] [Google Scholar]
- 2021. COVID-19: Risk for COVID-19 Infection, Hospitalization, and Death by Race /Ethnicity. (accessed )
- Association of social and demographic factors with COVID-19 incidence and death rates in the US. JAMA Netw Open. 2021;4(1):e2036462.
- [CrossRef] [Google Scholar]
- COVID-19 trends among persons aged 0–24 years — United States, March 1-December 12, 2020. 1. MMWR Morb Mortal Wkly Rep. 2021;70(3):88-94.
- [CrossRef] [Google Scholar]
- Racial disparities in incidence and outcomes among patients with COVID-19. JAMA Netw Open. 2020;3(9):e2021-892.
- [CrossRef] [Google Scholar]
- Healthy People 2030: Building a Healthier Future for All. (accessed )
- Social determinants of health in the United States: addressing major health inequality trends for the nation, 1935-2016. Int J MCH AIDS. 2017;6(2):139-164.
- [CrossRef] [Google Scholar]
- Health Resources and Services Administration. Office of Health Equity. 2020. Health Equity Report, 2019-2020: Special Feature on Housing and Health Inequalities. (accessed )
- [Google Scholar]
- Executive Order on Ensuring an Equitable Pandemic Response and Recovery. Washington, DC. Published January 21, 2021 (accessed )
- Executive Order on Ensuring a Data-Driven Response to COVID-19 and Future High-Consequence Public Health Threats. Published January 21, 2021 (accessed )
- Executive Order on Advancing Racial Equity and Support for Underserved Communities Through the Federal Government. Published January 20, 2021 (accessed )
- Household Pulse Survey Data Dictionary for SAS - Phase 1,Week 1,April 23 - May 5,2020; Phase 2,Week 13,August 19-31, 2020;Phase 3,Week 22,January 6-18, 2021. (accessed )
- Design and operation of the 2020 Household Pulse Survey. US Census Bureau; 2020. Forthcoming (accessed )
- 2021. Technical Documentation: Source of the Data and Accuracy of the Estimates for the Household Pulse Survey – Phase 3. (accessed )
- Psychological distress, life expectancy, and all-cause mortality in the United States: results from the 1997-2014 NHIS-NDI record linkage study. Ann. Epidemiol. 2021;56:9-17.
- [CrossRef] [Google Scholar]
- SUDAAN: Software for the Statistical Analysis of Correlated Data, Release 11.0.3. Research Triangle Park, NC: Research Triangle Institute; 2018.
- The impact of COVID-19 on small business owners: Evidence from the first 3 months after widespread social-distancing restrictions. J Econ Manag Strategy 2020:1-14.
- [CrossRef] [PubMed] [Google Scholar]
- The impact of COVID-19 on small business outcomes and expectations. Proc Natl Acad Sci USA. 2020;117(30):19656-17666.
- [CrossRef] [PubMed] [Google Scholar]
- How coronavirus has affected the mental health of the UK's self-employed. IPSE. Published September 10, 2020 (accessed )
- [Google Scholar]
- Inequalities in us life expectancy by area unemployment level, 1990–2010. Scientifica. 2016;2016:829043537.
- [CrossRef] [Google Scholar]
- How society shapes the health gradient: work-related health inequalities in a comparative perspective. Annu Rev Public Health. 2012;33:59-73.
- [CrossRef] [Google Scholar]
- Losing life and livelihood: a systematic review and meta-analysis of unemployment and all-cause mortality. Soc. Sci Med. 2011;72(6):840-854.
- [CrossRef] [Google Scholar]
- Unemployment and ill health. J Epidemiol Community Health. 1994;48(4):333-337.
- [CrossRef] [PubMed] [Google Scholar]
- How do state policies shape experiences of household income shocks and mental health during the COVID-19 pandemic? Soc. Sci Med. 2021;269:113557.
- [CrossRef] [Google Scholar]
- House passes $1.9 trillion stimulus bill with a variety of small business relief. Journal of Accountancy. Published February 27, 2021 (accessed )
- [Google Scholar]
- American Rescue Plan Act of 2021, H.R. 1319. February 23, 2021 (accessed )
- 2021. WHO Executive Board Stresses Need for Improved Response to Mental Health Impact of Public Health Emergencies. (accessed )