Translate this page into:
Trends in Physical and Mental Health, Mortality, Life Expectancy, and Social Inequalities Among American Indians and Alaska Natives, 1990-2019
✉Corresponding author email: gsingh@hrsa.gov.
Abstract
Objective:
To address the continuing gap in data and research on health and socioeconomic inequities characterizing Native Americans in the United States, this study examines major health and social inequality trends for the American Indian and Alaska Native (AIAN) populations covering several broad areas, including infant and child health, life expectancy and leading causes of death, physical and mental health, chronic disease prevalence, disability, health-risk behaviors, and health care access and quality.
Methods:
We used trend data from the 1990-2019 National Vital Statistics System, 2014-2018 National Health Interview Survey, and 2014-2018 American Community Survey to examine health, health care, mortality, and disease patterns for AIANs in relation to other racial/ethnic groups and the general population. Life tables, age-adjusted rates, risk ratios, and logistic regression were used to examine health inequalities.
Results:
In 2019, life expectancy of AIANs was 76.9 years, 11.3 years shorter than that for Asian/Pacific Islanders. The infant mortality rate for AIANs was 8.7 per 1,000 live births, 79% higher than the rate for non-Hispanic Whites. Risks of infant mortality from birth defects, low birthweight/prematurity, maternal complications, SIDS, and unintentional injury were significantly greater among AIANs compared with non-Hispanic Whites. Excess mortality among AIANs, particularly in rural areas, was found for working ages, diabetes, liver cirrhosis, alcohol- related causes, youth suicide, and unintentional injuries. About 18% of AIANs assessed their overall health as fair or poor, at twice the rate of non-Hispanic Whites or the general population. About 10% of AIAN adults experienced serious psychological distress, 2-to-5 times higher than the prevalence for other racial/ethnic groups. AIANs had the highest overall disability, mental and ambulatory disability, health uninsurance, unemployment, and poverty rates in the US, with differences in these indicators varying markedly across the AIAN tribes.
Conclusion and Implications for Translation:
AIANs remain a disadvantaged segment of the US population in a number of key health indicators and in socioeconomic and living conditions, with poverty rates in some tribal groups approaching or exceeding 40%.
Keywords
American Indians and Alaska Natives
Tribes
Social Determinants
Race/Ethnicity
Health Disparities
Life Expectancy
Infant Mortality
Leading Causes of Death
Chronic Disease

Introduction
The current social, emotional, and physical health status of American Indian and Alaska Native (AIAN) people in the United States exemplifies the enduring legacy and long-term consequences of a people who were historically forcibly displaced from their ancestral lands.1 Today, AIAN descendants of physically displaced ancestors who were pushed to the margins of their ancestral lands continue to experience disproportionately poor nutritional status, decreased access to safe drinking water, decreased educational and economic opportunities, poor health and access to care, and increased exposure to disease, illegal/illicit tobacco, drugs, alcohol, and violence.2-4
Decades and multiple generations after the historical displacement, AIANs—specifically those who live in rural areas—are more likely, when compared with other racial/ethnic groups, to experience poor mental and physical health, lack higher levels of education and be chronically unemployed.5,6 Generations of AIAN women and girls have experienced increased rates of low- birthweight babies, premature births, and infant mortality, and increased exposure to violence when compared to other racial/ethnic and social groups in the US.7 AIAN children are more likely to be hungry, overweight and obese, and experience these adverse events at an earlier age.8,9 AIAN adults experience high rates of obesity and deaths from cardiovascular disease, stroke, cancer, diabetes, and liver disease.10-13 AIANs also are more likely to initiate early and subsequently abuse tobacco,14 alcohol and illicit/illegal drugs, die prematurely from drug overdoses and from acute and chronic illnesses/disease.2 AIANs are at increased risk of committing suicide and of dying a victim of homicide.10,13 Furthermore, rural AIANs and Black/African Americans have the lowest life expectancy of all racial and ethnic populations in the US.15,16
High-quality health data on AIANs are limited in the federal data systems because of their relatively small population size, and because they are sometimes incorrectly classified as another race leading to an underestimation of their morbidity and mortality rates. Although AIANs represent a culturally heterogeneous population consisting of 574 federally recognized tribes, tribal-specific health and socioeconomic data are generally lacking except for those that are numerically large enough to be identified in decennial censuses and the American Community Survey.13,17 Additionally, to our knowledge, there are no prior studies that have examined in depth myriad health and socioeconomic challenges facing the Native American population across the life course using contemporary and time trend data within the scope of a single paper. Availability of such a comprehensive analysis is urgently needed to develop effective policy responses to reducing marked health inequities among the AIAN population and other racial/ethnic groups.
In this paper, we attempt to fill some of these data and research gaps by analyzing major health and social inequality trends for AIANs. Our analysis covers several broad areas, including infant and child health, life expectancy and leading causes of death, physical and mental health, chronic disease prevalence, disability, health-risk behaviors, and health care access and quality. We use recent census data to analyze social and economic conditions, disability, and health insurance coverage among AIANs by tribe. Additionally, we analyze data from two Health Resources and Services Administration (HRSA) programs, the Health Center Program and the Ryan White HIV/AIDS Program (RWHAP) that are aimed at reducing health, health care and social inequalities among ethnic-minority and socially-disadvantaged populations in the US, including AIANs.18-20 Analysis of the Health Center Program and RWHAP data on three important clinical performance indicators, hypertension control, diabetes control, and HIV viral suppression, illustrates the effectiveness of intervention programs at the national and local levels in addressing and reducing racial and ethnic inequities in health care outcomes.
Methods
US National Databases
Temporal data from the 1990-2019 National Vital Statistics System (NVSS), 2014-2018 National Health Interview Survey (NHIS), the 2014-2018 American Community Survey (ACS), the Health Center Program's 2019 Uniform Data System (UDS), and 2010-2019 RWHAP data were used to examine health, health care, mortality, and disease patterns for AIANs in relation to the other racial/ethnic groups and the general population.10,17,19-24 The time periods for these datasets that were available at the time of this study, varied as described below.
The NVSS has been the primary source for mortality analyses in the US by age, sex, race/ethnicity, cause of death, geographic area, and time period for over a century.10,13,25 The NVSS consists of both mortality and natality data systems. While the US Standard Certificate of Death, revised most recently in 2003, is the basis for the national mortality data, the natality component of the NVSS includes birth certificate data for approximately 4 million births that occur in the United States each year.10,13,25 We used the 2015-2018 linked birth/infant death data file26 and the 2015-2018 national natality file27 to examine racial/ethnic disparities in age- and cause- specific infant mortality and associated maternal and infant risk factors and birth outcomes.
The ACS is the primary census database for producing socioeconomic, demographic, housing, and labor force characteristics of various population groups at the national, state, county, and local levels.17,28,29 The unique advantage of the ACS is that it is conducted annually with a sample size of over 3 million records.17,28,29 The ACS uses a complex, multistage probability design and is representative of the civilian non-institutionalized population, covering all communities in the US.17,28,29 The household response rate for the ACS exceeds 98%.17,29 In this study, we used the 2014-2018 ACS Microdata Sample to analyze socioeconomic, health insurance, and disability data.29All ACS data are based on self-reports and obtained via mail-back questionnaire, telephone, and in-home personal interviews.17,28,29 Substantive and methodological details of the ACS are available in census and previous publications.17,28,29
The NHIS is a national sample household survey in which data on socioeconomic, demographic, behavioral, morbidity, health, and health care characteristics are collected via personal household interviews.13,24,30 All information collected in the survey are based on self-reports. The NHIS uses a complex, multistage probability design and is representative of the civilian non-institutionalized population of the United States. The NHIS, one of the longest running federal health surveys, has been conducted annually since 1957 by the National Center for Health Statistics.24,30 Response rate for an annual NHIS generally exceeds 87%. Data are obtained via in-home person interviews. Substantive and methodological details of the NHIS are described elsewhere.24,30
HRSA's Health Center Program aims to improve the health of the nation's underserved communities and vulnerable populations by assuring access to comprehensive, culturally competent, quality primary health care services.31 Nearly 30 million people nationwide receive primary medical, dental, and/or behavioral health care from approximately 1,500 HRSA-funded or supported health centers.18,31 The UDS is the main data system of the Health Center Program, which collects data on patient demographic characteristics, clinical processes and outcomes, and a number of clinical quality measures, including low birthweight, access to prenatal care, preventive health screenings and services, and chronic disease management including blood pressure control and uncontrolled diabetes.31
The RWHAP program works with states, counties, cities, and community-based organizations to provide HIV care and treatment services to more than half a million people with diagnosed HIV in the US.18,31 The program reaches more than 50% of all people diagnosed with HIV in the US and the majority of program clients are from low- income and racial/ethnic minority groups.31 One of the RWHAP health outcomes is viral suppression, which is a widely accepted outcome in HIV care and treatment. People with HIV who are virally suppressed have significantly lower risk of morbidity and mortality from HIV and have virtually no risk of sexually transmitting the disease to other.31
Health Indicators and Outcomes
We considered the following health indicators from NVSS: life expectancy at birth; infant mortality rates by age and cause of death; child and adolescent mortality; age-adjusted mortality rates from all-causes combined and from leading causes of death such as cardiovascular disease (CVD), cancer, unintentional injuries, chronic liver disease and cirrhosis, diabetes, chronic obstructive pulmonary disease (COPD), suicide, kidney disease, and influenza and pneumonia, Alzheimer's disease, septicemia, viral hepatitis, drug overdose, alcohol-related causes, and firearm injuries. We analyzed the following measures from NHIS and HRSA program databases: self-assessed health, serious psychological distress (SPD), heart disease, diabetes, hypertension, disability, obesity, smoking, hospital admission, emergency room (ER) visits, health insurance, and delayed or forgone medical care due to cost; HIV viral suppression, controlled diabetes and hypertension. SPD is measured by a 6-item scale (K6) that asks respondents how often they experienced each of 6 symptoms of psychological distress in the past 30 days (feelings of sadness, nervousness, restlessness, hopelessness, everything an effort, worthlessness). The K6 varies from 0 to 24, with a score of 13 or more used to define SPD.13,32 From the ACS, we considered the measures of overall disability status, cognitive and ambulatory disability, and health insurance.17,28,29
Race/Ethnicity Definitions
Race/ethnicity is defined differently in each of the major databases analyzed in terms of racial and ethnic detail. In the national mortality database from the NVSS, we considered the following major racial/ethnic groups: Non-Hispanic Whites, Black/African Americans, AIANs, APIs, and Hispanics. For the linked birth/infant death dataset and the national natality file, we considered the five major racial/ethnic groups as described above as well as API subgroups (Chinese, Japanese, Filipino, Asian Indian, Korean, Vietnamese, Hawaiians, and other Asian/Pacific islanders) and Hispanic subgroups (Mexican, Puerto Rican, Cuban, Central/South American, and other Hispanics). For the NHIS, we considered the five major racial/ethnic groups plus a residual category consisting of other and multiple-race groups. For the ACS, In addition to the five major racial/ethnic groups, we considered 35 AIAN tribes that were identified in the public-use microdata sample.28
Statistical Methods
Life tables, age-adjusted rates, prevalence, risk ratios, and logistic regression were used to examine health inequalities.6 We used the latest available county- level 2013 rural-urban continuum codes linked to the national mortality database to analyze rural- urban disparities in mortality among AIANs and other racial/ethnic groups.6,16 All-cause and cause- specific mortality rates were age-adjusted by the direct method using the age composition of the 2000 US population as the standard.10 The latest available area-based deprivation index based on the 2008-2012 ACS was linked to individual-level mortality data at the county level to derive working- age premature mortality rates according to levels of socioeconomic deprivation.6,33-35 Twenty-one indicators of education, occupation, wealth, income distribution, unemployment, rate, poverty rate, housing quality, and transportation were used to construct the index.33-35
Health, disease, and mortality patterns for AIANs were compared with those for non-Hispanic Whites, the total US population, and other major racial and ethnic minority groups where possible. Multivariable logistic regression was used to examine racial/ethnic disparities in health, disease, health behaviors, and health care factors including infant mortality, self- assessed health, serious psychological distress (SPD), heart disease, diabetes, hypertension, disability, obesity, smoking, hospital admission, emergency room (ER) visits, health insurance, and delayed or forgone medical care due to cost. Adjusted prevalence estimates were derived from the fitted logistic regression models. Infant mortality analyses based on linked birth/infant death data and disability, health insurance, and sociodemographic analyses based on ACS data were conducted by using SAS 9.4.36 To account for the complex sample design of the NHIS, SUDAAN software was used to conduct all statistical analyses of the NHIS data.37 The Chi-square statistic was used to test the overall association between each covariate and health and health care measures, while the t-test was used to test the difference in prevalence, incidence, or mortality rates between any two groups or time periods.6,35 Since multiple outcomes and comparisons were used, statistical tests of significance were carried out at the 0.05, 0.01, or 0.001 level when appropriate, although 95% confidence intervals of the estimates are presented throughout.35
Results
Disparities in Life Expectancy
In 2019, life expectancy at birth was 76.9 years for AIANs, significantly lower than that for Asian/Pacific Islanders (88.2), Hispanics (83.7), non-Hispanic Whites (79.1), and slightly higher than the life expectancy of African Americans (76.2) (Figure 1). Life expectancy for males ranged from a low of 72.6 years for African Americans and 74.2 years for AIANs to a high of 85.9 years for Asian/Pacific Islanders (APIs). Life expectancy for females ranged from a low of 79.5 years for African Americans and 79.6 years for AIANs to a high of 90.2 years for APIs (Figure 1).
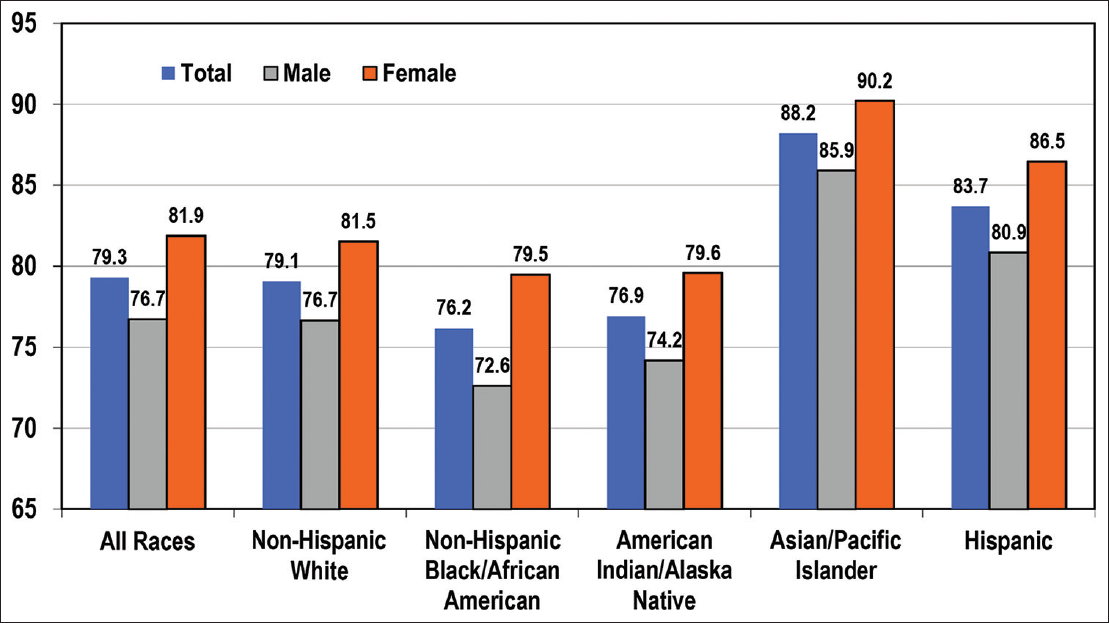
- Life Expectancy at Birth (Years) by Race/Ethnicity and Sex, United States, 2019 Source: Data derived from the National Vital Statistics System
The life table-based survival function indicates lower survival rates for AIANs compared to non- Hispanic Whites, APIs, and Hispanics (Table 1). For example, AIANs had a 78.3% probability of surviving from age 20 to age 65 years, while APIs had a 93.1% probability of surviving from age 20 to age 65 years (Table 1).
| Race/ethnicity | Survival from birth to age 20 years1 | Survival from age 20 to 65 years2 | Survival from age 65 to 85 years3 |
|---|---|---|---|
| Both Sexes Combined | |||
| American Indian/Alaska Native | 98.25 | 78.33 | 54.71 |
| Non-Hispanic White | 99.14 | 84.54 | 51.99 |
| Black/African American | 98.23 | 78.86 | 47.25 |
| Asian/Pacific Islander | 99.33 | 93.10 | 70.15 |
| Hispanic | 99.13 | 88.93 | 62.03 |
| All races (total population) | 98.98 | 84.75 | 52.88 |
| Male | |||
| American Indian/Alaska Native | 98.02 | 74.33 | 49.16 |
| Non-Hispanic White | 99.00 | 80.91 | 45.92 |
| Black/African American | 97.91 | 73.45 | 38.93 |
| Asian/Pacific Islander | 99.22 | 90.90 | 64.84 |
| Hispanic | 98.97 | 85.60 | 55.79 |
| All races (total population) | 98.81 | 80.97 | 46.58 |
| Female | |||
| American Indian/Alaska Native | 98.49 | 82.40 | 59.38 |
| Non-Hispanic White | 99.29 | 88.27 | 57.57 |
| Black/African American | 98.56 | 83.96 | 53.77 |
| Asian/Pacific Islander | 99.44 | 95.06 | 74.57 |
| Hispanic | 99.30 | 92.37 | 67.17 |
| All races (total population) | 98.81 | 80.97 | 46.58 |
Source: Based on data from the US National Vital Statistics System, 2019.
Derivations based on life tables for each racial/ethnic group. 1Obtained by dividing the number of survivors at age 20 to the size of birth cohort (radix) in the corresponding life table. 2Obtained by dividing the number of survivors at age 65 to those at age 25 years in the corresponding life table. 3Obtained by dividing the number of survivors at age 85 to those at age 55 years in the corresponding life table.
Disparities in infant, Child, and Maternal Health
During 2015-2018, the IMR (derived from the linked birth/infant death file) for AIANs was 8.71 per 1,000 live births, significantly higher than the rate for non- Hispanic Whites (4.87), APIs (4.07), Hispanics (4.97), and the total population (5.81), and lower than the rate of 11.05 for African Americans (Table 2). Indeed, the IMR for AIANs was 3.6 times higher than the rate for Chinese, and the postneonatal mortality rate for AIANs was the highest of all the major racial/ethnic groups. During 2015-2018, AIAN infants experienced higher risks of mortality from three leading causes of death, birth defects, sudden infant death syndrome (SIDS), and unintentional injuries compared to other racial/ethnic groups (Table 2). AIAN infants also experienced significantly higher risks of mortality from maternal complications and perinatal conditions compared to non-Hispanic Whites, Hispanics, and APIs.
| Race/ ethnicity | Number of Infant Deaths | Infant Mortality Rate | Neonatal Mortality Rate | Postneonatal Mortality Rate | Perinatal Conditions IMR | Birth Defects IMR | LBW and Prematurity IMR | SIDS IMR | Maternal Complications IMR | Un- intentional Injury IMR |
|---|---|---|---|---|---|---|---|---|---|---|
| All Races (US total) | 90,454 | 5.81 | 3.86 | 1.95 | 286.48 | 120.52 | 99.24 | 36.96 | 36.87 | 32.03 |
| American Indian/AN | 1,243 | 8.71 | 4.53 | 4.18 | 314.23 | 167.53 | 94.16 | 95.44 | 35.14 | 79.28 |
| Non- Hispanic White | 40,654 | 4.87 | 3.17 | 1.70 | 218.09 | 112.61 | 67.94 | 36.03 | 26.21 | 30.97 |
| Non- Hispanic Black | 26,058 | 11.05 | 7.26 | 3.79 | 611.55 | 151.54 | 248.26 | 74.22 | 79.49 | 64.59 |
| Asian/ Pacific Islander | 4,475 | 4.07 | 2.92 | 1.15 | 222.40 | 85.54 | 69.25 | 13.14 | 32.62 | 11.94 |
| Chinese | 569 | 2.42 | 1.73 | 0.69 | 141.44 | 43.19 | 42.04 | 6.82 | 13.29 | 8.51 |
| Japanese | 77 | 2.89 | 1.79 | 1.10 | 126.05 | 79.84 | 34.45 | 11.39 | 23.09 | 11.37 |
| Hawaiian | 30 | 9.07 | 4.24 | 4.83 | 363.33 | 151.17 | 60.30 | 60.35 | 30.12 | 30.12 |
| Filipino | 614 | 5.03 | 3.68 | 1.35 | 263.33 | 123.68 | 71.12 | 15.62 | 45.42 | 15.59 |
| Asian Indian | 1,161 | 3.90 | 3.10 | 0.80 | 256.91 | 63.55 | 83.20 | 3.73 | 40.47 | 5.40 |
| Korean | 172 | 2.90 | 1.90 | 1.00 | 134.18 | 69.71 | 42.55 | 13.52 | 23.72 | 15.19 |
| Vietnamese | 324 | 3.97 | 2.73 | 1.24 | 185.58 | 104.83 | 58.01 | 14.75 | 32.37 | 11.04 |
| Samoan | 75 | 8.75 | 4.67 | 4.08 | 408.73 | 81.74 | 140.05 | 128.25 | 93.33 | 58.38 |
| Other API | 1,452 | 5.47 | 3.73 | 1.74 | 269.53 | 127.66 | 87.61 | 23.42 | 36.14 | 18.49 |
| Hispanic | 18,024 | 4.97 | 3.51 | 1.46 | 250.72 | 127.31 | 83.60 | 19.79 | 35.02 | 17.51 |
| Mexican | 10,329 | 4.94 | 3.45 | 1.50 | 240.65 | 133.83 | 79.46 | 19.08 | 34.07 | 18.20 |
| Puerto Rican | 1,749 | 6.16 | 4.37 | 1.79 | 348.75 | 101.83 | 124.61 | 33.15 | 49.89 | 27.88 |
| Cuban | 358 | 3.95 | 2.91 | 1.04 | 233.08 | 61.30 | 73.40 | 14.40 | 37.78 | 17.70 |
| Central/ South American | 2,444 | 4.22 | 3.08 | 1.14 | 217.97 | 124.04 | 76.23 | 11.95 | 28.74 | 9.00 |
| Other Hispanic | 3,144 | 5.39 | 3.84 | 1.54 | 274.30 | 129.86 | 87.36 | 24.44 | 37.03 | 18.40 |
Source: Data derived from the 2015-2018 Linked Birth/Infant Death Period Files AN = Alaska Native. LBW = Low Birthweight. SIDS = Sudden Infant Death Syndrome. Infant, neonatal, and postneonatal mortality rates are per 1,000 live births, whereas cause-specific infant mortality rates are per 100,000 live births
With respect to several of the risk factors for infant mortality, AIAN mothers were generally worse off than the other racial/ethnic groups as they had some of the highest rates of teen birth, smoking before and during pregnancy, gestational hypertension, gestational diabetes, pre-pregnancy obesity, and delayed or no prenatal care (Table 3). Controlling for several sociodemographic risk factors, smoking during pregnancy, and prenatal care reduced excess risk of mortality among AIAN infants. However, compared to non-Hispanic White infants, AIANs continued to experience 36% higher adjusted odds of infant mortality, 22% higher adjusted odds of neonatal mortality, and 49% higher adjusted odds of postneonatal mortality (Table 4). When compared with Chinese infants, AIANs had 79% higher adjusted odds of infant mortality, 72% higher adjusted odds of neonatal mortality, and 60% higher adjusted odds of postneonatal mortality (Table 4). After controlling for risk factors, compared to non-Hispanic Whites, AIAN infants had 17% higher odds of birth defects mortality, 31% higher odds of mortality from low birthweight and prematurity, and 38% higher odds of SIDS mortality (Table 5).
| Race/ Ethnicity | Maternal age <20 Years | Maternal age ≥35 Years | Maternal education <12Years | Maternal education ≥16 Years | Unmarried mother | Foreign- born | Parity ≥3 | 3rd Trimester or no prenatal care | Pre- pregnancy obesity (BMI≥30) | Smoking in pregnancy | Smoking Before pregnancy | Maternal hyper- tension | Gestational diabetes | Preterm birth (<37 weeks) | Low birth weight (<2500 g) |
|---|---|---|---|---|---|---|---|---|---|---|---|---|---|---|---|
| All Races | 5.28 | 17.28 | 13.59 | 32.07 | 37.65 | 22.91 | 12.62 | 6.15 | 26.68 | 7.09 | 9.24 | 8.31 | 7.05 | 1 1.51 | 8.20 |
| American Indian/AN | 9.79 | 1 1.09 | 21.14 | 9.69 | 65.1 1 | 1.26 | 22.76 | 1 1.94 | 37.75 | 16.76 | 20.92 | 10.62 | 10.90 | 14.20 | 8.01 |
| Non- Hispanic White | 3.83 | 17.55 | 7.44 | 41.20 | 28.10 | 6.91 | 10.53 | 4.45 | 24.57 | 10.32 | 13.19 | 8.56 | 6.27 | 10.23 | 7.00 |
| Non- Hispanic Black | 7.79 | 14.13 | 14.36 | 17.09 | 68.22 | 16.10 | 16.95 | 9.86 | 36.52 | 6.14 | 8.03 | 1 1.61 | 6.1 1 | 16.66 | 13.61 |
| Asian/ Pacific Islander | 1.09 | 25.20 | 7.67 | 60.38 | 12.62 | 77.86 | 6.40 | 5.67 | 10.96 | 0.91 | 1.48 | 5.12 | 12.23 | 9.97 | 8.47 |
| Chinese | 0.22 | 31.81 | 5.82 | 70.17 | 8.26 | 86.61 | 2.30 | 6.71 | 3.18 | 0.21 | 0.43 | 2.83 | 10.85 | 7.23 | 5.93 |
| Japanese | 0.17 | 49.68 | 1.46 | 68.41 | 6.48 | 72.42 | 3.52 | 3.76 | 5.34 | 0.92 | 1.77 | 4.38 | 7.58 | 8.77 | 8.45 |
| Filipino | 1.01 | 34.04 | 2.58 | 54.65 | 16.33 | 72.31 | 7.38 | 4.01 | 13.13 | 0.97 | 1.94 | 9.37 | 13.24 | 12.51 | 9.93 |
| Asian Indian | 0.32 | 20.65 | 4.15 | 79.70 | 2.66 | 89.79 | 2.78 | 4.32 | 10.96 | 0.14 | 0.27 | 4.84 | 14.68 | 9.85 | 10.46 |
| Korean | 0.24 | 40.95 | 0.68 | 79.16 | 6.16 | 76.63 | 3.23 | 4.27 | 5.67 | 1.18 | 2.20 | 4.58 | 9.10 | 8.06 | 6.25 |
| Vietnamese | 0.77 | 29.70 | 9.38 | 42.21 | 16.51 | 79.04 | 5.30 | 4.47 | 4.35 | 0.42 | 0.74 | 3.55 | 12.89 | 10.50 | 7.95 |
| Hawaiian | 5.63 | 16.93 | 14.63 | 17.90 | 46.96 | 6.90 | 22.35 | 9.78 | 38.06 | 9.24 | 11.58 | 9.64 | 9.19 | 14.47 | 9.10 |
| Samoan | 4.56 | 12.57 | 12.37 | 7.40 | 35.16 | 47.96 | 29.00 | 13.76 | 66.57 | 6.64 | 8.60 | 10.23 | 11.37 | 13.92 | 6.21 |
| Other API | 2.95 | 20.62 | 17.01 | 35.50 | 25.65 | 61.52 | 14.06 | 7.60 | 18.63 | 2.20 | 3.25 | 5.96 | 11.28 | 11.57 | 8.55 |
| Hispanic | 8.08 | 26.91 | 28.76 | 13.22 | 53.73 | 48.32 | 16.10 | 7.64 | 29.56 | 1.78 | 2.82 | 6.49 | 7.72 | 11.46 | 7.36 |
| Mexican | 8.53 | 15.36 | 30.63 | 10.25 | 43.13 | 45.97 | 18.38 | 7.81 | 31.41 | 1.43 | 2.32 | 6.28 | 8.28 | 10.98 | 6.96 |
| Puerto Rican | 8.65 | 12.97 | 17.53 | 16.04 | 63.08 | 27.96 | 13.19 | 5.95 | 32.20 | 5.86 | 8.91 | 8.04 | 7.51 | 12.91 | 9.49 |
| Cuban | 3.44 | 16.84 | 8.20 | 28.44 | 50.80 | 54.91 | 5.38 | 3.90 | 21.29 | 2.02 | 3.02 | 7.35 | 6.20 | 12.07 | 7.20 |
| Central/ South American | 6.02 | 21.88 | 38.68 | 18.22 | 47.50 | 83.10 | 13.81 | 9.16 | 22.02 | 0.52 | 1.05 | 5.62 | 7.06 | 11.94 | 6.95 |
| Other Hispanic | 8.95 | 14.05 | 20.93 | 15.27 | 47.39 | 31.08 | 13.32 | 6.90 | 30.16 | 2.27 | 3.46 | 7.19 | 6.69 | 11.88 | 8.21 |
Source: Data derived from the 2015-2018 Linked Birth/lnfant Death Period files, AN-Alaska Native, API-Asian/Pacific Islander
| Race/ethnicity | Infant Mortality | Infant Mortality | Neonatal Mortality | Neonatal Mortality | Postneonatal Mortality | Postneonatal Mortality | ||||||||||||
|---|---|---|---|---|---|---|---|---|---|---|---|---|---|---|---|---|---|---|
| Model 11 | Model 22 | Model 11 | Model 22 | Model 11 | Model 22 | |||||||||||||
| OR | 95% CI | OR | 95% CI | OR | 95% CI | OR | 95% CI | OR | 95% CI | OR | 95% CI | |||||||
| Non- Hispanic White | 1.00 | Reference | 1.00 | Reference | 1.00 | Reference | 1.00 | Reference | 1.00 | Reference | 1.00 | Reference | ||||||
| American Indian/Alaska Native | 1.79 | 1.69 | 1.90 | 1.36 | 1.28 | 1.44 | 1.43 | 1.32 | 1.55 | 1.22 | 1.13 | 1.32 | 2.45 | 2.26 | 2.66 | 1.49 | 1.37 | 1.62 |
| Non- Hispanic Black | 2.28 | 2.25 | 2.32 | 1.84 | 1.80 | 1.87 | 2.30 | 2.26 | 2.35 | 1.92 | 1.88 | 1.96 | 2.22 | 2.17 | 2.28 | 1.67 | 1.62 | 1.72 |
| Chinese | 0.50 | 0.46 | 0.54 | 0.76 | 0.70 | 0.83 | 0.55 | 0.49 | 0.60 | 0.71 | 0.64 | 0.78 | 0.41 | 0.35 | 0.47 | 0.93 | 0.80 | 1.09 |
| Japanese | 0.59 | 0.47 | 0.74 | 0.87 | 0.69 | 1.09 | 0.57 | 0.43 | 0.75 | 0.70 | 0.53 | 0.93 | 0.65 | 0.45 | 0.93 | 1.39 | 0.96 | 2.00 |
| Hawaiian | 1.87 | 1.30 | 2.67 | 1.63 | 1.13 | 2.33 | 1.34 | 0.79 | 2.26 | 1.21 | 0.72 | 2.05 | 2.84 | 1.74 | 4.64 | 2.25 | 1.38 | 3.69 |
| Filipino | 1.03 | 0.95 | 1.12 | 1.48 | 1.36 | 1.60 | 1.16 | 1.06 | 1.28 | 1.49 | 1.36 | 1.64 | 0.79 | 0.68 | 0.92 | 1.44 | 1.23 | 1.69 |
| Asian Indian | 0.80 | 0.76 | 0.85 | 1.31 | 1.23 | 1.39 | 0.98 | 0.92 | I.05 | 1.35 | 1.26 | 1.44 | 0.47 | 0.41 | 0.53 | 1.16 | 1.02 | 1.33 |
| Korean | 0.59 | 0.51 | 0.69 | 0.87 | 0.75 | 1.02 | 0.60 | 0.50 | 0.72 | 0.73 | 0.61 | 0.88 | 0.59 | 0.45 | 0.76 | 1.36 | 1.05 | 1.76 |
| Vietnamese | 0.82 | 0.73 | 0.91 | 1.07 | 0.96 | 1.20 | 0.86 | 0.76 | 0.98 | 1.02 | 0.89 | 1.17 | 0.73 | 0.60 | 0.89 | 1.23 | 1.01 | 1.50 |
| Samoan | 1.80 | 1.44 | 2.26 | 1.80 | 1.43 | 2.26 | 1.47 | 1.08 | 2.01 | 1.51 | 1.11 | 2.07 | 2.40 | 1.72 | 3.34 | 2.29 | 1.64 | 3.20 |
| Other Asian/ Pacific Islander | 1.12 | 1.07 | 1.18 | 1.30 | 1.24 | 1.38 | 1.18 | 1.11 | 1.26 | 1.30 | 1.22 | 1.39 | 1.02 | 0.93 | 1.12 | 1.33 | 1.21 | 1.46 |
| Mexican | 1.01 | 0.99 | 1.04 | 1.03 | 1.00 | 1.05 | 1.09 | 1.06 | 1.12 | 1.15 | 1.12 | 1.19 | 0.88 | 0.85 | 0.91 | 0.82 | 0.79 | 0.86 |
| Puerto Rican | 1.27 | 1.21 | 1.33 | 1.18 | 1.13 | 1.24 | 1.38 | I.31 | 1.46 | 1.31 | 1.24 | 1.39 | 1.05 | 0.96 | 1.15 | 0.97 | 0.89 | 1.06 |
| Cuban | 0.81 | 0.73 | 0.90 | 0.86 | 0.77 | 0.96 | 0.92 | 0.81 | 1.04 | 0.93 | 0.82 | 1.05 | 0.61 | 0.50 | 0.75 | 0.72 | 0.59 | 0.89 |
| Central & South American | 0.87 | 0.83 | 0.90 | 0.92 | 0.88 | 0.96 | 0.97 | 0.93 | 1.02 | 1.01 | 0.96 | 1.06 | 0.67 | 0.62 | 0.72 | 0.76 | 0.70 | 0.83 |
| Other Hispanic | 1.11 | 1.07 | 1.15 | 1.13 | 1.09 | 1.17 | 1.21 | 1.16 | 1.27 | 1.28 | 1.23 | 1.34 | 0.91 | 0.85 | 0.97 | 0.86 | 0.80 | 0.92 |
Source: Data derived from the 2015-2018 Linked Birth/Infant Death Period Files OR=odds ratio; CI=confidence interval; 1Unadjusted for other covariates 2Adjusted for maternal age, parity, marital status, nativity, plurality, infant sex, maternal education, place and region of residence, smoking during pregnancy, and prenatal care
| Race/ethnicity | Birth Defects | Birth Defects | LBW and Prematurity | LBW and Prematurity | SIDS | SIDS | ||||||||||||
|---|---|---|---|---|---|---|---|---|---|---|---|---|---|---|---|---|---|---|
| Model 11 | Model 22 | Model 11 | Model 22 | Model 11 | Model 22 | |||||||||||||
| OR | 95% CI | OR | 95% CI | OR | 95% CI | OR | 95% CI | OR | 95% CI | OR | 95% CI | |||||||
| Non- Hispanic White | 1.00 | Reference | 1.00 | Reference | 1.00 | Reference | 1.00 | Reference | 1.00 | Reference | 1.00 | Reference | ||||||
| American Indian/Alaska Native | 1.49 | 1.31 | 1.69 | 1.17 | 1.03 | 1.34 | 1.39 | 1.17 | 1.64 | 1.31 | 1.10 | 1.56 | 2.65 | 2.23 | 3.14 | 1.38 | 1.15 | 1.64 |
| Non- Hispanic Black | 1.35 | 1.29 | 1.40 | 1.17 | 1.12 | 1.22 | 3.66 | 3.53 | 3.79 | 2.85 | 2.73 | 2.97 | 2.06 | 1.94 | 2.18 | 1.46 | 1.37 | 1.56 |
| Chinese | 0.38 | 0.32 | 0.47 | 0.45 | 0.37 | 0.55 | 0.62 | 0.51 | 0.76 | 0.89 | 0.73 | 1.09 | 0.19 | 0.12 | 0.31 | 0.73 | 0.44 | 1.21 |
| Japanese | 0.71 | 0.46 | 1.09 | 0.79 | 0.51 | 1.21 | 0.51 | 0.27 | 0.97 | 0.71 | 0.37 | 1.36 | 0.32 | 0.10 | 0.98 | 1.03 | 0.33 | 3.19 |
| Hawaiian | 1.34 | 0.56 | 3.22 | 1.17 | 0.49 | 2.82 | 0.89 | 0.22 | 3.54 | 0.89 | 0.22 | 3.55 | 1.67 | 0.42 | 6.69 | 1.12 | 0.28 | 4.50 |
| Filipino | 1.10 | 0.94 | 1.29 | 1.21 | 1.03 | 1.43 | 1.05 | 0.85 | 1.29 | 1.55 | 1.25 | 1.93 | 0.43 | 0.28 | 0.68 | 1.02 | 0.65 | 1.61 |
| Asian Indian | 0.56 | 0.49 | 0.65 | 0.69 | 0.60 | 0.81 | 1.23 | 1.08 | 1.39 | 1.74 | 1.53 | 2.00 | 0.10 | 0.06 | 0.19 | 0.48 | 0.26 | 0.86 |
| Korean | 0.62 | 0.46 | 0.84 | 0.71 | 0.52 | 0.96 | 0.63 | 0.42 | 0.93 | 0.82 | 0.55 | 1.21 | 0.38 | 0.19 | 0.75 | 1.48 | 0.74 | 2.98 |
| Vietnamese | 0.93 | 0.75 | 1.15 | 0.94 | 0.75 | 1.16 | 0.85 | 0.64 | 1.14 | 1.12 | 0.84 | 1.49 | 0.41 | 0.23 | 0.72 | 0.97 | 0.55 | 1.71 |
| Samoan | 0.73 | 0.35 | 1.52 | 0.65 | 0.31 | 1.35 | 2.06 | 1.17 | 3.63 | 2.61 | 1.48 | 4.60 | 3.56 | 1.97 | 6.43 | 3.09 | 1.70 | 5.60 |
| Other Asian/ Pacific Islander | 1.13 | 1.02 | 1.26 | 1.09 | 0.97 | 1.22 | 1.29 | 1.13 | 1.47 | 1.53 | 1.34 | 1.75 | 0.65 | 0.51 | 0.84 | 0.95 | 0.73 | 1.23 |
| Mexican | 1.19 | 1.14 | 1.24 | 1.02 | 0.97 | 1.07 | 1.17 | 1.11 | 1.24 | 1.41 | 1.33 | 1.50 | 0.53 | 0.48 | 0.59 | 0.50 | 0.45 | 0.56 |
| Puerto Rican | 0.90 | 0.80 | 1.02 | 0.95 | 0.85 | 1.07 | 1.84 | 1.65 | 2.04 | 1.63 | 1.46 | 1.83 | 0.92 | 0.75 | 1.13 | 0.88 | 0.71 | 1.09 |
| Cuban | 0.54 | 0.42 | 0.71 | 0.55 | 0.42 | 0.72 | 1.08 | 0.85 | 1.38 | 1.06 | 0.83 | 1.36 | 0.40 | 0.23 | 0.69 | 0.56 | 0.33 | 0.97 |
| Central & South American | 1.10 | 1.02 | 1.19 | 0.96 | 0.88 | 1.04 | 1.12 | 1.02 | 1.24 | 1.22 | 1.10 | 1.35 | 0.33 | 0.26 | 0.42 | 0.51 | 0.39 | 0.65 |
| Other Hispanic | 1.15 | 1.07 | 1.24 | 1.12 | 1.03 | 1.21 | 1.29 | 1.18 | 1.41 | 1.48 | 1.34 | 1.62 | 0.68 | 0.57 | 0.80 | 0.61 | 0.51 | 0.73 |
Source: Data derived from the 2015-2018 Linked Birth/Infant Death Period Files OR=odds ratio; CI=confidence interval; LBW=low birthweight. SIDS=sudden infant death syndrome. 1Unadjusted for other covariates. 2Adjusted for maternal age, parity, marital status, nativity, plurality, infant sex, maternal education, place and region of residence, smoking during pregnancy, and prenatal care
During 2015-2019, the overall mortality rate for AIAN children and adolescents aged 1-17 years was significantly higher than the rates for non-Hispanic Whites, Hispanics, and the total population substantially and lower than the rate for African Americans (Table 6). Rural AIAN children had the highest all-cause child and adolescent mortality rates of all major racial/ ethnic groups. Rural AIAN children and adolescents had the highest mortality from unintentional injuries and suicide. Suicide mortality among AIAN children aged 5-17 was 5.18 per 100,000 population, compared with 3.78 for non-Hispanic Whites, 1.94 for African Americans, 2.29 for APIs, and 2.02 for Hispanics. Suicide mortality among AIAN children in rural areas was twice as high as the overall AIAN rate (Table 6).
| All-Cause Mortality | Deaths | Death Rate (95% CI) | SE (Death Rate) |
|---|---|---|---|
| American Indian/Alaska Native | 1,466 | 22.46 (21.31-23.61) | 0.59 |
| Asian/Pacific Islander | 2,846 | 12.93 (12.46-13.41) | 0.24 |
| Black/African American | 17,198 | 29.56 (29.12-30.00) | 0.23 |
| Non-Hispanic White | 35,145 | 19.09 (18.89-19.29) | 0.10 |
| Hispanic/Latino | 14,377 | 16.45 (16.18-16.72) | 0.14 |
| All Races | 70,253 | 20.20 (20.05-20.34) | 0.08 |
| All-Cause Mortality, Rural/Non-Metro Areas Only | |||
| American Indian/Alaska Native | 790 | 40.69 (37.85-43.53) | 1.45 |
| Asian/Pacific Islander | 152 | 19.28 (16.22-22.35) | 1.56 |
| Black/African American | 1,718 | 33.87 (32.27-35.47) | 0.82 |
| Non-Hispanic White | 9,057 | 26.18 (25.64-26.72) | 0.28 |
| Hispanic/Latino | 1,381 | 21.07 (19.96-22.18) | 0.57 |
| All Races | 13,020 | 27.05 (26.59-27.52) | 0.24 |
| Unintentional-Injury Mortality | |||
| American Indian/Alaska Native | 511 | 7.83 (7.15-8.51) | 0.35 |
| American Indian/Alaska Native (Rural) | 289 | 14.89 (13.17-16.60) | 0.88 |
| Asian/Pacific Islander | 639 | 2.90 (2.68-3.13) | 0.11 |
| Black/African American | 4,595 | 7.90 (7.67-8.13) | 0.12 |
| Non-Hispanic White | 11,588 | 6.29 (6.18-6.41) | 0.06 |
| Hispanic/Latino | 4,281 | 4.90 (4.75-5.04) | 0.07 |
| All Races | 21,359 | 6.14 (6.06-6.22) | 0.04 |
| Suicide Mortality1 | |||
| American Indian/Alaska Native | 259 | 5.18 (4.55-5.81) | 0.32 |
| American Indian/Alaska Native (Rural) | 147 | 10.05 (8.43-11.68) | 0.83 |
| Asian or Pacific Islander | 387 | 2.29 (2.06-2.52) | 0.12 |
| Black/African American | 864 | 1.94 (1.81-2.07) | 0.07 |
| Non-Hispanic White | 5,393 | 3.78 (3.68-3.88) | 0.05 |
| Hispanic/Latino | 1,349 | 2.02 (1.91 -2.13) | 0.06 |
| All Races | 8,192 | 3.05 (2.99-3.12) | 0.03 |
Source: Data derived from the National Vital Statistics System. CI=confidence interval. SE=Standard error. 1Suicide rates are computed for children and adolescents aged 5-17 years
The analysis of the 2014-2018 ACS data revealed that AIAN children had significantly higher disability rates (5.51%) than non-Hispanic Whites (4.22%), APIs (2.17%), and Hispanics (4.07%), and African- Americans (5.14%) (Table 7). Cognitive disability rates were also significantly higher among AIAN children than other children from racial/ethnic groups except African Americans. Approximately 13.01% of AIAN children lacked health insurance, compared with 3.94% of non-Hispanic Whites, 4.19% of African Americans, 4.08% of APIs, and 7.85% of Hispanics.
| Race/Ethnicity and American Indian & Alaska Native Tribe | Total Disability Rate | Cognitive Disability Rate | Health Uninsurance Rate | Poverty Rate |
|---|---|---|---|---|
| Total population | 4.25 | 4.27 | 5.01 | 19.60 |
| Non-Hispanic White | 4.22 | 4.30 | 3.94 | 11.83 |
| Black/African American | 5.14 | 5.24 | 4.19 | 34.78 |
| Asian and Pacific Islander | 2.17 | 1.79 | 4.08 | 11.92 |
| Hispanic | 4.07 | 3.86 | 7.85 | 28.50 |
| American Indian and Alaska Native (AIAN) | 5.51 | 5.27 | 13.01 | 32.99 |
| Apache | 4.64 | 5.00 | 10.70 | 44.11 |
| Blackfeet | 9.86 | 12.30 | 21.66 | 35.37 |
| Cherokee | 6.65 | 5.95 | 14.08 | 25.97 |
| Cheyenne | 4.23 | 5.34 | 14.18 | 32.14 |
| Chicksaw | 8.51 | 6.94 | 18.45 | 13.84 |
| Chippewa | 6.54 | 7.46 | 13.27 | 30.00 |
| Choctaw | 7.29 | 6.36 | 15.98 | 20.68 |
| Comanche | 4.30 | 2.52 | 22.29 | 38.61 |
| Creek | 5.40 | 4.94 | 12.39 | 26.08 |
| Crow | 1.26 | 1.45 | 29.66 | 38.20 |
| Hopi | 3.29 | 2.02 | 8.41 | 33.33 |
| Iroquois | 7.77 | 8.72 | 12.35 | 27.75 |
| Lumbee | 4.03 | 3.60 | 2.76 | 33.82 |
| Mexican American Indian | 4.42 | 4.11 | 8.03 | 29.30 |
| Navajo | 3.41 | 3.00 | 14.28 | 41.92 |
| Pima | 6.14 | 5.69 | 20.09 | 45.12 |
| Potawatomi | 5.74 | 5.02 | 13.10 | 19.41 |
| Pueblo | 4.82 | 4.40 | 15.42 | 30.88 |
| Puget Sound Salish | 4.86 | 4.05 | 21.04 | 19.26 |
| Seminole | 2.75 | 2.44 | 32.44 | 21.69 |
| Sioux | 5.56 | 5.70 | 14.31 | 49.73 |
| South American Indian | 5.15 | 6.04 | 2.96 | 30.00 |
| Tohono O'Odham | 5.66 | 4.62 | 16.35 | 51.62 |
| Yaqui | 5.69 | 5.58 | 11.39 | 42.13 |
| Other specified AI tribes alone | 5.66 | 5.25 | 13.31 | 31.89 |
| All other specified AI tribe combinations | 5.92 | 5.71 | 12.98 | 31.59 |
| American Indian, tribe not specified | 5.18 | 4.63 | 10.06 | 22.43 |
| Alaskan Athabascan | 5.44 | 4.34 | 14.28 | 28.98 |
| Tlingit-Haida | 5.48 | 3.65 | 14.59 | 14.17 |
| Inupiat | 3.17 | 3.08 | 13.22 | 29.90 |
| Yup'ik | 2.13 | 1.63 | 13.08 | 30.08 |
| Aleut | 4.21 | 3.49 | 14.60 | 28.86 |
| Other Alaska Native | 10.41 | 13.37 | 30.83 | 23.19 |
| Other AIAN specified | 8.35 | 8.39 | 14.05 | 30.20 |
| AIAN, not specified | 6.35 | 6.11 | 9.48 | 33.51 |
Source: Data derived from the 2014-2018 American Community Survey Cognitive difficulty is defined for children aged 5-17 years
Child disability and health insurance coverage varied substantially across various AIAN tribes. Overall disability rates ranged between 7% and 10% for children from Blackfeet, Chicksaw, Iroquois, and Choctaw tribes (Table 7), while children from Crow, Yup'ik, and Seminole tribes had the lowest disability rates (<3%). Children from Blackfeet (12.30%), Iroquois (8.72%), and Chippewa (7.46%) had the highest mental disability rates, while those from Crow (1.45%), Yup'ik (1.63%), and Hopi (2.02%) had the lowest mental disability rates (Table 7).
The tribes for which child health uninsurance rates exceeded 20% included Pima (20.09%), Puget Sound Salish (21.04%), Blackfeet (21.66%), Comanche (22.29), Crow (29.66%), and Seminole (32.44%).
Lumbee (2.76%) and South American Indian (2.96%) had the lowest child health uninsurance rates (Table 7).
Socioeconomic conditions under which children of various ethnicities live vary greatly. Poverty among AIAN children is a major social problem. During 2014-2018, 32.99% AIAN children lived below the poverty line, compared with 34.78% of African American children, 11.92% of API children, 11.83% of non-Hispanic White children, and 28.50% of Hispanic children. Some of the tribes with the highest child poverty rates include Tohono O'Odham (51.62%), Sioux (49.73%), Pima (45.12%), Apache (44.11%), Yaqui (42.13%), Navajo (41.92%), Comanche (38.61%), Crow (38.20%), and Blackfeet (35.37%). Chicksaw (13.84%) and Tlingit-Haida (14.17%) tribes had the lowest child poverty rates.
Disparities in Mortality from Leading Causes of Death, 2019
CVD, cancer, unintentional injuries, chronic liver disease and cirrhosis, diabetes, COPD, suicide, kidney disease, and influenza and pneumonia, and Alzheimer's disease were the top 10 leading causes of death among AIANs and accounted for 74.28% of all deaths among them in 2019 (Table 8). All-cause mortality and mortality from CVD and cancer were significantly lower among AIANs compared with non-Hispanic Whites and the total US population. Unintentional-injury mortality among AIANs was similar to that for Whites but was 11% higher than the rate for the total population. The risk of diabetes mortality among AIANs was 62% higher than that for non-Hispanic Whites and 43% higher than the rate for the total population. Liver cirrhosis mortality among AIANs was at least 2.32 times higher than that for non-Hispanic Whites and the total population. Although drug overdose mortality was 26% lower among AIANs than non-Hispanic Whites, alcohol- related mortality was approximately three times higher among AIANs compared with non-Hispanic Whites and the total US population. The homicide rate for AIANs was 2.70 times higher than the rate for non-Hispanic Whites and 1.21 times higher than the rate for the total population. The risk of firearm- injury mortality was significantly lower for AIANs than for non-Hispanic Whites and the general population (Table 8).
| AIAN | AIAN | NHW | Total Population | AIAN | NHW | US | |||
|---|---|---|---|---|---|---|---|---|---|
| Deaths | Death rate | Deaths | Death rate | Deaths | Death rate | Percent | Percent | Percent | |
| All Causes of Death | 21,118 | 561.22 | 2,189,567 | 736.76 | 2,854,838 | 715.25 | 100.0 | 100.0 | 100.0 |
| Major Cardiovascular Diseases (CVD) | 4,912 | 141.10 | 668,570 | 215.46 | 869,883 | 213.42 | 23.3 | 30.5 | 30.5 |
| Heart Disease | 3,756 | 106.49 | 513,673 | 165.77 | 659,041 | 161.52 | 17.8 | 23.5 | 23.1 |
| Stroke | 817 | 24.55 | 111,060 | 35.59 | 150,005 | 36.96 | 3.9 | 5.1 | 5.3 |
| All Cancers Combined | 3,557 | 94.37 | 462,064 | 151.37 | 599,601 | 146.15 | 16.8 | 21.1 | 21.0 |
| Lung Cancer | 823 | 21.95 | 114,068 | 36.5 | 139,682 | 33.43 | 3.9 | 5.2 | 4.9 |
| Colorectal Cancer | 358 | 9.45 | 39,227 | 13.17 | 52,986 | 13.10 | 1.7 | 1.8 | 1.9 |
| Breast Cancer | 241 | 11.8 | 30,717 | 19.38 | 42,281 | 19.42 | 1.1 | 1.4 | 1.5 |
| Prostate Cancer | 167 | 11.89 | 23,310 | 17.41 | 31,638 | 18.32 | 0.8 | 1.1 | 1.1 |
| Cervical Cancer | 36 | 1.53 | 2,563 | 1.99 | 4,152 | 2.13 | 0.2 | 0.1 | 0.1 |
| Liver & IBD Cancer | 280 | 7.00 | 18,515 | 5.91 | 27,959 | 6.59 | 1.3 | 0.8 | 1.0 |
| Stomach Cancer | 115 | 3.02 | 6,209 | 2.06 | 11,092 | 2.76 | 0.5 | 0.3 | 0.4 |
| Accidents and Adverse Effects | 2,415 | 54.71 | 125,755 | 54.63 | 173,040 | 49.29 | 11.4 | 5.7 | 6.1 |
| Diabetes Mellitus | 1,150 | 30.85 | 57,325 | 19.03 | 87,647 | 21.58 | 5.4 | 2.6 | 3.1 |
| Chronic Liver Disease and Cirrhosis | 1,210 | 27.49 | 31,976 | 11.83 | 44,358 | 11.34 | 5.7 | 1.5 | 1.6 |
| COPD | 911 | 26.28 | 136,454 | 43.53 | 156,979 | 38.18 | 4.3 | 6.2 | 5.5 |
| Suicide | 658 | 13.58 | 37,672 | 17.56 | 47,511 | 13.94 | 3.1 | 1.7 | 1.7 |
| Pneumonia and Influenza | 410 | 11.56 | 38,150 | 12.48 | 49,783 | 12.32 | 1.9 | 1.7 | 1.7 |
| Alzheimer's disease | 381 | 14.13 | 100,532 | 31.44 | 121,499 | 29.85 | 1.8 | 4.6 | 4.3 |
| Nephritis and Kidney Diseases | 422 | 12.10 | 35,153 | 11.35 | 51,565 | 12.71 | 2.0 | 1.6 | 1.8 |
| Septicemia | 298 | 7.90 | 28,195 | 9.32 | 38,431 | 9.51 | 1.4 | 1.3 | 1.3 |
| Homicide | 350 | 7.31 | 5,264 | 2.71 | 19,141 | 6.03 | 1.7 | 0.2 | 0.7 |
| Viral Hepatitis | 77 | 1.66 | 2,728 | 0.95 | 4,285 | 1.03 | 0.4 | 0.1 | 0.2 |
| Drug Overdose Mortality | 897 | 19.21 | 50,347 | 25.93 | 70,630 | 21.65 | 4.2 | 2.3 | 2.5 |
| Alcohol-Related Causes | 1,450 | 31.90 | 28,061 | 11.14 | 39,043 | 10.38 | 6.9 | 1.3 | 1.4 |
| Firearm Injuries | 432 | 9.03 | 24,151 | 11.04 | 39,707 | 11.86 | 2.0 | 1.1 | 1.4 |
| Firearm Injuries (Rural) | 189 | 15.02 | 5,791 | 15.07 | 7,229 | 15.41 | 0.9 | 0.3 | 0.3 |
Source: CDC/NCHS. National Vital Statistics System. 2019 Mortality Detail File. Death rates are directly standardized to the 2000 US standard population. IBD- Intrahepatic bile duct. COPD-Chronic obstructive pulmonary diseases
Trends and Disparities in Mortality from Selected Causes of Death, 1990-2019
Working-age mortality between ages 15 and 64 years is sensitive to social and economic fluctuations and is greatly influenced by deaths due to suicide, homicide, injuries, drug overdoses, alcohol-related causes, CVD, and cancer.34 While working-age mortality rates declined consistently between 1990 and 2010, there has been an upward trend in mortality since 2010 for all AIANs and rural AIANs as well as for non-Hispanic Whites and the total US population (Figure 2A). The increases in working-age mortality between 2010 and 2019 were more rapid for rural AIANs and for all AIANs than for non-Hispanic Whites and the total population. In 2019, rural AIANs were almost twice as likely to die prematurely in working ages as the total population.

- (A-F): Trends in Working-Age Mortality and Cause-Specific Mortality among American Indians and Alaska Natives, Non-His- panic Whites, and the total US Population, 1990-2019 Source: Data derived from the 1990-2019 National Vital Statistics System
Youth suicide rates have risen since 2001 for all groups, but the rate of increase has been particularly high for AIAN youth (Figure 2B). Suicide rates increased by 56% for all AIAN youth and by 91% for AIAN youth in rural areas. In 2019, compared to the national average, suicide rates were 58% higher among all AIAN youth and 232% higher among AIAN youth in rural areas.
Cirrhosis mortality, for which heavy alcohol consumption is the most important risk factor, has historically been higher among AIANs than among non-Hispanic Whites or the national average. Cirrhosis mortality rates have been rising since 2006, and the rates are currently 4.2 times higher among rural AIANs than the national average (Figure 2C). Diabetes mortality, which is the highest among African Americans and AIANs, increased between 1990 and 2005, but declined between 2006 and 2019 for all groups, with AIANs experiencing a 23% decrease in their mortality rates (Figure 2D). In 2019, compared with the total population, the risk of diabetes mortality was 43% greater for all AIANs and 133% greater for rural AIANs.
Motor vehicle injuries are a prominent cause of death in the US, with AIANs having the highest risk of mortality of all racial/ethnic groups. Although motor-vehicle-related mortality declined significantly during 1999-2010, it showed a relatively stable trend for all groups between 2010 and 2019 (Figure 2E). In 2019, the risk of motor-vehicle-related mortality was 36% greater for all AIANs and 182% greater for rural AIANs compared with the total population.
Non-motor vehicle unintentional injury mortality rates doubled for the total population and non- Hispanic Whites and increased by 63% for AIANs between 2000 and 2019, with steep increases in drug overdose deaths contributing greatly to the rising trend. Increases in drug-overdose mortality have been more rapid for non-Hispanic Whites and the total population compared to AIANs (data not shown). Nonetheless, in 2019, AIANs in rural areas had 65% higher non-motor vehicle unintentional injury mortality than the national average (Figure 2F).
Working-age mortality varies greatly in relation to area socioeconomic deprivation levels (Figure 3). AIANs living in more deprived communities have 2.62 times higher premature mortality than those in more affluent communities (428 deaths vs. 163 deaths per 100,000 population). Similar socioeconomic patterns in premature mortality can be seen for other racial/ethnic groups, including rural AIANs (Figure 3).

- Working-Age (15-64) Mortality by Race/Ethnicity and Socioeconomic Deprivation Level, United States, 2014-2018 Source: Data derived from the National Vital Statistics System
Disparities in Disability, Chronic Conditions, Health insurance, and Risk Factors
The overall disability rate was highest among AIANs (Table 9). Approximately 17.55% of the AIAN population reported a disability during 2014-2018, compared with 14.49% of non-Hispanic Whites, 14.57% of African Americans, 7.20% of APIs, 9.12% of Hispanics, and 13.10% of the total US population. AIANs also reported significantly higher mental and ambulatory disability rates than other racial/ethnic groups.
| Race/Ethnicity and American Indian & Alaska Native Tribe | Total Disability Rate | Cognitive Disability Rate | Ambulatory Disability Rate | Health Uninsurance Rate | Poverty Rate | Unemp- loyment Rate | Without High School Diploma | With At Least Bechelor's Degree |
|---|---|---|---|---|---|---|---|---|
| Total population | 13.10 | 5.44 | 7.35 | 8.32 | 14.11 | 5.81 | 29.73 | 23.13 |
| Non-Hispanic White | 14.49 | 5.61 | 8.09 | 5.81 | 10.03 | 4.66 | 22.90 | 27.36 |
| Black/African American | 14.57 | 6.82 | 8.92 | 11.71 | 24.20 | 10.41 | 33.54 | 14.59 |
| Asian and Pacific Islander | 7.20 | 2.88 | 3.87 | 6.76 | 11.79 | 4.68 | 27.65 | 40.14 |
| Hispanic | 9.12 | 4.36 | 4.77 | 17.47 | 21.12 | 6.73 | 49.55 | 9.99 |
| American Indian and Alaska Native (AIAN) | 17.55 | 7.90 | 9.99 | 21.14 | 25.82 | 11.08 | 39.21 | 9.92 |
| Apache | 19.49 | 8.21 | 11.90 | 15.75 | 32.22 | 16.94 | 39.22 | 7.46 |
| Blackfeet | 21.73 | 10.93 | 13.61 | 26.01 | 31.55 | 12.68 | 35.07 | 12.85 |
| Cherokee | 24.15 | 10.12 | 14.85 | 19.24 | 21.16 | 8.53 | 31.68 | 13.91 |
| Cheyenne | 17.84 | 10.63 | 11.55 | 28.18 | 32.13 | 15.74 | 40.34 | 10.26 |
| Chicksaw | 17.15 | 7.51 | 8.99 | 21.23 | 12.25 | 5.62 | 32.77 | 15.26 |
| Chippewa | 17.87 | 8.67 | 9.40 | 17.98 | 24.93 | 11.22 | 35.88 | 9.46 |
| Choctaw | 18.85 | 7.61 | 10.46 | 22.31 | 17.50 | 6.93 | 37.05 | 14.32 |
| Comanche | 17.85 | 5.54 | 9.45 | 29.69 | 26.56 | 11.04 | 29.01 | 14.52 |
| Creek | 17.55 | 6.36 | 10.53 | 20.28 | 18.82 | 7.73 | 31.86 | 14.07 |
| Crow | 10.45 | 5.03 | 6.47 | 36.23 | 32.21 | 15.10 | 41.94 | 8.77 |
| Hopi | 12.58 | 6.16 | 6.63 | 16.20 | 27.55 | 7.05 | 31.81 | 7.36 |
| Iroquois | 20.85 | 8.45 | 12.68 | 14.14 | 21.31 | 11.86 | 27.95 | 14.36 |
| Lumbee | 16.60 | 7.10 | 10.95 | 13.86 | 24.35 | 7.37 | 40.81 | 11.18 |
| Mexican American Indian | 10.73 | 5.35 | 5.34 | 25.96 | 21.00 | 7.41 | 57.01 | 7.71 |
| Navajo | 13.72 | 6.03 | 7.11 | 22.34 | 33.19 | 13.04 | 40.61 | 6.75 |
| Pima | 15.25 | 6.41 | 8.75 | 28.25 | 36.10 | 13.75 | 49.39 | 6.28 |
| Potawatomi | 15.95 | 4.99 | 9.57 | 18.07 | 16.17 | 8.05 | 33.79 | 14.2 |
| Pueblo | 14.34 | 5.97 | 7.00 | 25.14 | 25.83 | 13.40 | 36.37 | 10.26 |
| Puget Sound Salish | 13.34 | 4.62 | 7.51 | 20.60 | 18.07 | 11.01 | 40.96 | 8.52 |
| Seminole | 15.85 | 6.96 | 10.37 | 38.88 | 23.85 | 12.78 | 39.1 | 9.12 |
| Sioux | 16.30 | 8.29 | 9.13 | 26.84 | 41.92 | 15.43 | 44.85 | 7.57 |
| South American Indian | 14.87 | 7.22 | 7.93 | 11.99 | 19.77 | 8.71 | 31.31 | 20.29 |
| Tohono O'Odham | 14.88 | 6.16 | 8.11 | 22.05 | 42.18 | 20.98 | 51.67 | 2.98 |
| Yaqui | 17.60 | 9.43 | 10.17 | 20.20 | 28.05 | 12.62 | 42.68 | 6.78 |
| Other specified AI tribes alone | 16.70 | 6.94 | 9.35 | 20.42 | 24.55 | 11.26 | 38.22 | 10 |
| All other specified AI tribe combinations | 17.47 | 8.00 | 9.79 | 19.12 | 24.15 | 11.74 | 36.10 | 9.92 |
| American Indian, tribe not specified | 17.24 | 8.01 | 10.20 | 17.68 | 19.67 | 7.02 | 38.55 | 12.66 |
| Alaskan Athabascan | 19.79 | 8.70 | 10.95 | 25.56 | 23.37 | 17.32 | 34.06 | 10.05 |
| Tlingit-Haida | 18.67 | 7.91 | 10.54 | 23.56 | 18.98 | 12.78 | 25.62 | 10.93 |
| Inupiat | 14.23 | 5.48 | 6.73 | 26.59 | 26.83 | 18.96 | 43.33 | 6.87 |
| Yup'ik | 11.94 | 4.25 | 5.73 | 23.60 | 27.96 | 22.30 | 47.16 | 2.75 |
| Aleut | 17.87 | 8.61 | 9.32 | 24.96 | 21.29 | 13.33 | 36.39 | 11.82 |
| Other Alaska Native | 17.14 | 9.09 | 8.24 | 27.56 | 22.20 | 12.23 | 39.80 | 6.67 |
| Other AIAN specified | 24.93 | 13.65 | 13.73 | 20.76 | 24.86 | 15.35 | 38.65 | 8.17 |
| AIAN, not specified | 18.94 | 9.03 | 10.99 | 18.14 | 25.53 | 9.66 | 43.28 | 9.05 |
Source: Data derived from the 2014-2018 American Community Survey
Disability rates varied among AIAN tribes. Cherokee (24.15%), Blackfeet (21.73%), and Iroquois (20.85%) had the highest disability rates, while Crow (10.45%), Mexican American Indians (10.73%) and Yup'ik (11.94%) had the lowest disability rates. Blackfeet (10.93%), Cheyenne (10.93%), and Cherokee (10.12%) had the highest mental disability rates, while Yup'ik (4.25%), Puget Sound Salish (4.62%), and Potawatomi (4.99%) had the lowest mental disability rates. Cherokee (14.85%), Blackfeet (13.61%), and Iroquois (12.68%) had the highest ambulatory disability rates, while Mexican American Indians (5.34%), Yup'ik (5.73%), and Crow (6.47%) had the lowest ambulatory disability rates (Table 9).
During 2014-2018, AIANs had the highest rate of uninsurance. Approximately 21.14% of AIANS lacked health insurance, compared with 5.81% of non- Hispanic Whites, 11.71% of African Americans, 6.76% of APIs, and 17.47% of Hispanics. Among the AIAN tribes, Seminole (38.88%), Crow (36.23), Comanche (29.69%), Pima (28.25%), and Cheyenne (28.18%) had the highest rates of uninsurance, while South American Indians (11.99%), Lumbee (13.86%), and Iroquois (14.14%) had the lowest rates of uninsurance (Table 9).
Most racial/ethnic minorities in the US have historically been disadvantaged in terms of social and economic attainment and living conditions.6,31 Current data on poverty, unemployment, and education continue to reflect these patterns (Table 9). During 2014-2018, AIANs had the highest poverty rate (25.82%), followed by Black/African Americans (24.20%), Hispanics (21.12%), APIs (11.79%), and non-Hispanic Whites (10.03%). Unemployment rates were more than two times higher among AIANs (11.08%) and Blacks (10.41%) compared with non-Hispanic Whites (4.66%). With respect to educational attainment, AIANs were least likely to have a college degree. About 9.92% of AIANs had a college degree, compared with 27.36% of non-Hispanic Whites, 14.6% of Blacks, 9.99% of Hispanics, and 40.14% APIs. These social determinants varied greatly across the AIAN tribes. The poverty rate was highest among Tohono O'Odham (42.18%), followed by Sioux (41.92%), Pima (36.10%), Navajo (33.19%), Apache (32.22%), Crow (32.21%), Cheyenne (32.13%), and Blackfeet (31.55%). Chickasaw (12.25%) and Potawatomi (16.17%) had the lowest poverty rates. Several tribes reported high rates of unemployment, such as Yup'ik (22.30%), Tohono O'Odham (20.98%), Inupiat (18.96%), Alaskan Athabascan (17.32%), and Apache (16.94%). Chicksaw (5.62%) and Choctaw (6.93%) had the lowest unemployment rates (Table 9).
Table 10 shows racial/ethnic disparities in selected leading health indicators and health-risk factors. During 2014-2018, the prevalence of heart disease among AIANs (18.26%) was 45% higher than that for non-Hispanic Whites (12.59%) and 160% higher than the prevalence for APIs (7.01%). After controlling for socioeconomic and demographic factors, AIANs had 38% higher odds of heart disease than non-Hispanic Whites and 176% higher odds of heart disease than APIs. The prevalence of physician- diagnosed diabetes was highest among AIANs (20.45%), 151 % higher than the prevalence for non- Hispanic White adults (8.13%) and 115% higher than the prevalence for API (9.52%) (Table 10). Controlling for sociodemographic factors, AIANs experienced 164% higher odds of diabetes than non-Hispanic Whites and 64% higher odds than Blacks. About 18.00% of AIANs assessed their health as fair or poor, a significantly higher percentage than any other major/racial ethnic group. The corresponding prevalence of self-reported health as fair or poor was 8.50% for non-Hispanic Whites and 7.98% for APIs. Controlling for sociodemographic factors, AIANs had 56% higher odds of reporting fair or poor health than non-Hispanic Whites and 1.90 times higher odds than APIs.
Regarding mental health problems, 10.01% of AIAN adults during 2014-2018 experienced serious psychological distress during the past one month, compared with 3.46% of non-Hispanic Whites and 1.80% of APIs (Table 10). Controlling for sociodemographic factors, AIANs experienced 77% higher odds of serious psychological distress than non-Hispanic Whites and 302% higher odds than APIs.
| Age-Adjusted | Odds | 95% CI | Covariate-Adjusted | Odds | 95% CI | |||||
|---|---|---|---|---|---|---|---|---|---|---|
| Prevalence (%) | SE | Ratio | Prevalence (%) | SE | Ratio | |||||
| Race/ethnicity | Self-Assessed Fair/Poor Health (p<.001) | Self-Assessed Fair/Poor Health (p<.001) | ||||||||
| Non-Hispanic White | 8.50 | 0.10 | 1.00 | Reference | 9.67 | 0.11 | 1.00 | Reference | ||
| Non-Hispanic Black | 14.94 | 0.26 | 1.99 | 1.90 | 2.09 | 11.53 | 0.19 | 1.25 | 1.20 | 1.31 |
| American Indian/ Alaska Native | 18.00 | 0.95 | 2.55 | 2.21 | 2.95 | 13.56 | 0.70 | 1.56 | 1.36 | 1.79 |
| Asian/Pacific Islander | 7.98 | 0.25 | 0.93 | 0.86 | 1.00 | 8.23 | 0.25 | 0.82 | 0.76 | 0.88 |
| Hispanic | 13.32 | 0.25 | 1.72 | 1.63 | 1.81 | 10.06 | 0.19 | 1.05 | 1.00 | 1.11 |
| Multiple race | 12.86 | 1.33 | 1.64 | 1.27 | 2.12 | 12.37 | 1.22 | 1.38 | 1.06 | 1.78 |
| Race/ethnicity | Serious Psychological Distress (p<.001) | Serious Psychological Distress (p<.001) | ||||||||
| Non-Hispanic White | 3.46 | 0.10 | 1.00 | Reference | 4.08 | 0.12 | 1.00 | Reference | ||
| Non-Hispanic Black | 3.75 | 0.23 | 1.09 | 0.95 | 1.24 | 2.84 | 0.18 | 0.68 | 0.59 | 0.78 |
| American Indian/ Alaska Native | 10.01 | 1.77 | 3.11 | 2.11 | 4.58 | 6.84 | 1.28 | 1.77 | 1.16 | 2.68 |
| Asian/Pacific Islander | 1.80 | 0.21 | 0.51 | 0.40 | 0.65 | 1.86 | 0.22 | 0.44 | 0.34 | 0.56 |
| Hispanic | 4.06 | 0.20 | 1.18 | 1.05 | 1.32 | 2.97 | 0.15 | 0.71 | 0.63 | 0.81 |
| Multiple race | 6.76 | 1.86 | 2.02 | 1.13 | 3.62 | 6.50 | 1.78 | 1.67 | 0.91 | 3.06 |
| Race/ethnicity | Heart Disease (p<.001) | Heart Disease (p<.001) | ||||||||
| Non-Hispanic White | 12.59 | 0.16 | 1.00 | Reference | 12.95 | 0.17 | 1.00 | Reference | ||
| Non-Hispanic Black | 11.13 | 0.32 | 0.86 | 0.80 | 0.92 | 10.13 | 0.30 | 0.74 | 0.68 | 0.80 |
| American Indian/ Alaska Native | 18.26 | 1.49 | 1.63 | 1.30 | 2.03 | 16.53 | 1.39 | 1.38 | 1.10 | 1.73 |
| Asian/Pacific Islander | 7.01 | 0.39 | 0.50 | 0.44 | 0.57 | 7.33 | 0.42 | 0.50 | 0.44 | 0.57 |
| Hispanic | 8.72 | 0.32 | 0.64 | 0.59 | 0.70 | 8.04 | 0.30 | 0.56 | 0.51 | 0.61 |
| Multiple race | 22.48 | 3.73 | 2.19 | 1.35 | 3.54 | 23.05 | 3.82 | 2.21 | 1.35 | 3.62 |
| Race/ethnicity | Diabetes (p<.001) | Diabetes (p<.001) | ||||||||
| Non-Hispanic White | 8.13 | 0.12 | 1.00 | Reference | 8.46 | 0.13 | 1.00 | Reference | ||
| Non-Hispanic Black | 14.07 | 0.34 | 1.95 | 1.82 | 2.09 | 12.50 | 0.32 | 1.61 | 1.5 | 1.73 |
| American Indian/ Alaska Native | 20.45 | 2.02 | 3.26 | 2.44 | 4.35 | 18.07 | 1.88 | 2.64 | 1.97 | 3.55 |
| Asian/Pacific Islander | 9.52 | 0.47 | 1.20 | 1.07 | 1.36 | 9.96 | 0.50 | 1.21 | 1.07 | 1.37 |
| Hispanic | 13.32 | 0.37 | 1.82 | 1.68 | 1.97 | 11.97 | 0.35 | 1.53 | 1.41 | 1.65 |
| Multiple race | 14.40 | 3.17 | 2.01 | 1.14 | 3.53 | 14.40 | 3.14 | l.94 | 1.1 | 3.42 |
| Race/ethnicity | Smoking (p<.001) | Smoking (p<.001) | ||||||||
| Non-Hispanic White | 17.03 | 0.23 | 1.06 | 1.00 | Reference | 18.53 | 0.24 | 1.00 | Reference | |
| Non-Hispanic Black | 16.01 | 0.43 | 0.93 | 0.87 | 0.99 | 12.85 | 0.35 | 0.63 | 0.59 | 0.67 |
| American Indian/ Alaska Native | 27.88 | 2.36 | 1.90 | 1.50 | 2.41 | 23.46 | 1.95 | 1.38 | 1.09 | 1.75 |
| Asian/Pacific Islander | 8.17 | 0.43 | 0.43 | 0.38 | 0.48 | 9.14 | 0.49 | 0.42 | 0.37 | 0.48 |
| Hispanic | 9.85 | 0.30 | 0.53 | 0.49 | 0.57 | 8.23 | 0.26 | 0.37 | 0.35 | 0.40 |
| Multiple race | 19.68 | 3.21 | 1.20 | 0.80 | 1.80 | 20.38 | 3.10 | 1.14 | 0.75 | 1.71 |
| Race/ethnicity | Obesity (p<.01) | Obesity (p<.001) | ||||||||
| Non-Hispanic White | 29.14 | 0.25 | 1.00 | Reference | 29.52 | 0.25 | 1.00 | Reference | ||
| Non-Hispanic Black | 40.14 | 0.57 | 1.64 | 1.56 | 1.73 | 38.40 | 0.58 | 1.50 | 1.43 | 1.58 |
| American Indian/ Alaska Native | 45.57 | 2.67 | 2.06 | 1.66 | 2.55 | 43.86 | 2.67 | 1.89 | 1.52 | 2.36 |
| Asian/Pacific Islander | 11.67 | 0.54 | 0.32 | 0.29 | 0.35 | 12.40 | 0.57 | 0.33 | 0.30 | 0.37 |
| Hispanic | 33.37 | 0.51 | 1.22 | 1.16 | 1.28 | 32.57 | 0.52 | 1.16 | 1.10 | 1.22 |
| Multiple race | 30.38 | 3.89 | 1.06 | 0.74 | 1.53 | 30.96 | 3.86 | 1.07 | 0.75 | 1.54 |
| Race/ethnicity | Hypertension (p<.001) | Hypertension (p<.001) | ||||||||
| Non-Hispanic White | 29.99 | 0.23 | 1.00 | Reference | 30.53 | 0.23 | 1.00 | Reference | ||
| Non-Hispanic Black | 41.86 | 0.48 | 1.94 | 1.84 | 2.04 | 39.75 | 0.49 | 1.68 | 1.6 | 1.78 |
| American Indian/ Alaska Native | 35.22 | 1.56 | 1.35 | 1.14 | 1.60 | 33.27 | 1.54 | 1.17 | 0.98 | 1.4 |
| Asian/Pacific Islander | 26.81 | 0.63 | 0.82 | 0.76 | 0.89 | 27.97 | 0.65 | 0.86 | 0.79 | 0.93 |
| Hispanic | 29.71 | 0.46 | 0.98 | 0.93 | 1.04 | 28.35 | 0.47 | 0.88 | 0.83 | 0.93 |
| Multiple race | 33.87 | 3.44 | 1.25 | 0.85 | 1.83 | 34.70 | 3.49 | l.27 | 0.86 | l.88 |
Source: Data derived from the 2014-2018 National Health Interview Survey SE=Standard error; CI=Confidence interval.
1Adjusted by logistic regression for age only. 2Adjusted for age, survey year gender geographic region, income/poverty level, and housing tenure Self-assessed health is for the entire population, including children and adults. Prevalence of serious psychological distress, heart disease, diabetes, smoking, obesity, and hypertension is for adults aged 18 years and older.
Smoking, obesity, and hypertension are major risk factors that are associated with increased risk of mortality and morbidity from several chronic diseases such as CVD, cancer, diabetes, and COPD.AIANs have one of the highest rates of adult smoking, obesity, and hypertension, significantly higher than the rates for non-Hispanic Whites, APIs, and Hispanics (Table 10). During 2014-2018, 27.88% of AIAN adults were current smokers, 45.57% were obese, and 35.22% were diagnosed with hypertension. Controlling for sociodemographic factors, AIAN adults had 38% higher odds of smoking than non-Hispanic Whites, 229% higher odds than APIs, 273% higher odds than Hispanics, and 119% higher odds of smoking than Blacks. Controlling for sociodemographic factors, AIANs had 89% higher odds of obesity than non- Hispanic Whites and 473% higher odds of obesity than APIs. Controlling for sociodemographic factors reduced excess risk of hypertension of hypertension among AIANs. However, they still had 33% to 36% higher adjusted odds of hypertension than their API and Hispanic counterparts (Table 10).
Figure 4 shows gradients in health outcomes and behavioral-risk factors among AIANs according to poverty/income level, an important social determinant. Although AIANs living below the poverty line had significantly higher risk of each negative health outcome than their high-income counterparts, income gradients in self-assessed fair/ poor health and serious psychological distress were particularly large and consistent. For example, AIANs living below the poverty line were 4.39 times more likely to assess their overall health as fair/poor than AIANs with family incomes at or above 400% of the poverty threshold (27.58% vs. 6.28%). AIANs living below the poverty line were 13.35 times more likely to experience serious psychological distress than AIANs with family incomes at or above 400% of the poverty threshold (16.82% vs. 1.26%).

- Age-Adjusted Prevalence of Selected Health Indicators and Health-Risk Behaviors among American Indians and Alaska Natives by Family Income/Poverty Level, United States, 2014-2018
- Source: Data derived from the 2014-2018 National Health Interview Survey
- Notes: Income/poverty gradients were statistically significant at p<.05 for all outcomes except heart disease (p=.055). Self-assessed health is for the entire population, including children and adults. Prevalence of serious psychological distress, heart disease, diabetes, smoking, obesity, and hypertension is for adults aged 18 years and older
Disparities in Health Care Access, Quality, and Clinical Outcomes
An important measure of access to quality health care is affordability.6,31 There were marked racial/ethnic disparities in unmet medical need. During 2014- -2018, 8.53% of AIAN adults and 7.98% of African- American adults reported not receiving medical care because they could not afford it, compared with 5.29% of non-Hispanic Whites, 6.53% of Hispanics, and 3.01% of APIs. Additionally, 10.22% of AIAN adults and 9.05% of African-American adults forwent or delayed seeking medical care because of the worry about the cost, compared with 4.34% of APIs and 8.00% of non-Hispanic Whites. After adjusting for sociodemographic differences, AIANs did not differ from non-Hispanic Whites in delayed medical care due to cost but had 46% higher odds of delayed medical care compared to APIs. After adjusting for sociodemographic differences, AIANs did not differ from non-Hispanic Whites in the non-receipt of needed medical care but had 54% higher odds of not receiving care compared to APIs (Table 11).
| Unadjusted | Odds | 95% CI | Covariate-Adjusted | Odds | 95% CI | |||||
|---|---|---|---|---|---|---|---|---|---|---|
| Prevalence (%) | SE | Ratio | Prevalence (%) | SE | Ratio | |||||
| Race/ethnicity | 1+ER visits in past year (N=153,586; p<.001) | 1+ER visits in past year (p<.001) | ||||||||
| Non-Hispanic White | 19.02 | 0.19 | 1.00 | Reference | 19.11 | 0.21 | 1.00 | Reference | ||
| Non-Hispanic Black | 26.30 | 0.50 | 1.52 | 1.44 | 1.60 | 23.11 | 0.46 | 1.28 | 1.21 | 1.36 |
| American Indian/Alaska Native | 32.30 | 1.73 | 2.03 | 1.74 | 2.37 | 27.84 | 1.62 | 1.67 | 1.41 | 1.97 |
| Asian/Pacific Islander | 11.40 | 0.49 | 0.55 | 0.50 | 0.60 | 15.46 | 0.71 | 0.77 | 0.68 | 0.86 |
| Hispanic | 17.95 | 0.36 | 0.93 | 0.88 | 0.98 | 17.62 | 0.42 | 0.90 | 0.84 | 0.97 |
| Multiple race | 20.19 | 2.74 | 1.08 | 0.77 | 1.51 | 21.67 | 2.69 | 1.18 | 0.85 | 1.63 |
| Race/ethnicity | 2+ER visits in past year (N=153,586; p<.001) | 2+ER visits in past year (p<.001) | ||||||||
| Non-Hispanic White | 6.57 | 0.12 | 1.00 | Reference | 6.69 | 0.13 | 1.00 | Reference | ||
| Non-Hispanic Black | 11.26 | 0.33 | 1.81 | 1.68 | 1.94 | 8.63 | 0.27 | 1.33 | 1.23 | 1.43 |
| American Indian/Alaska Native | 16.95 | 1.59 | 2.90 | 2.32 | 3.63 | 12.69 | 1.28 | 2.09 | 1.64 | 2.66 |
| Asian/Pacific Islander | 3.35 | 0.25 | 0.49 | 0.42 | 0.58 | 5.16 | 0.44 | 0.75 | 0.62 | 0.91 |
| Hispanic | 6.56 | 0.24 | 1.00 | 0.92 | 1.09 | 6.32 | 0.28 | 0.94 | 0.84 | 1.05 |
| Multiple race | 6.93 | 1.45 | 1.06 | 0.68 | 1.65 | 7.30 | 1.48 | 1.10 | 0.71 | 1.72 |
| Race/ethnicity | Hospital admission in past year (N=345,532; p<.001) | Hospital admission in past year (p<.001) | ||||||||
| Non-Hispanic White | 8.40 | 0.08 | 1.00 | Reference | 8.31 | 0.09 | 1.00 | Reference | ||
| Non-Hispanic Black | 9.34 | 0.17 | 1.12 | 1.08 | 1.17 | 8.36 | 0.16 | 1.01 | 0.96 | 1.06 |
| American Indian/Alaska Native | 8.95 | 0.64 | 1.07 | 0.92 | 1.25 | 7.70 | 0.60 | 0.92 | 0.78 | 1.09 |
| Asian/Pacific Islander | 4.81 | 0.18 | 0.55 | 0.51 | 0.60 | 6.41 | 0.26 | 0.75 | 0.69 | 0.82 |
| Hispanic | 6.63 | 0.14 | 0.77 | 0.74 | 0.81 | 7.09 | 0.16 | 0.84 | 0.79 | 0.89 |
| Multiple race | 7.66 | 1.11 | 0.90 | 0.67 | 1.23 | 9.24 | 1.25 | 1.13 | 0.83 | 1.52 |
| Race/ethnicity | Delayed medical care due to cost in past year (N=350,683; p<.001) | Delayed medical care due to cost in past year (p<.001) | ||||||||
| Non-Hispanic White | 8.00 | 0.1 | 1.00 | Reference | 9.07 | 0.12 | 1.00 | Reference | ||
| Non-Hispanic Black | 9.05 | 0.21 | 1.14 | 1.09 | 1.21 | 6.49 | 0.15 | 0.68 | 0.65 | 0.72 |
| American Indian/Alaska Native | 10.22 | 1.09 | 1.31 | 1.04 | 1.65 | 7.40 | 0.85 | 0.79 | 0.61 | 1.02 |
| Asian/Pacific Islander | 4.34 | 0.19 | 0.52 | 0.48 | 0.57 | 5.22 | 0.23 | 0.54 | 0.49 | 0.59 |
| Hispanic | 8.25 | 0.2 | 1.03 | 0.98 | 1.09 | 6.74 | 0.17 | 0.71 | 0.67 | 0.76 |
| Multiple race | 12.26 | 1.56 | 1.61 | 1.21 | 2.14 | 11.69 | 1.36 | 1.35 | 1.02 | 1.79 |
| Race/ethnicity | Did not get needed medical care due to cost in past year (N=350,633; p<.001) | Did not get needed medical care due to cost in past year (p<.001) | ||||||||
| Non-Hispanic White | 5.29 | 0.08 | 1.00 | Reference | 6.26 | 0.10 | 1.00 | Reference | ||
| Non-Hispanic Black | 7.98 | 0.20 | 1.55 | 1.47 | 1.64 | 5.35 | 0.14 | 0.84 | 0.79 | 0.89 |
| American Indian/Alaska Native | 8.53 | 0.86 | 1.67 | 1.35 | 2.07 | 5.78 | 0.62 | 0.91 | 0.72 | 1.16 |
| Asian/Pacific Islander | 3.01 | 0.16 | 0.56 | 0.50 | 0.62 | 3.87 | 0.21 | 0.59 | 0.52 | 0.66 |
| Hispanic | 6.53 | 0.17 | 1.25 | 1.18 | 1.33 | 4.97 | 0.14 | 0.77 | 0.72 | 0.83 |
| Multiple race | 9.18 | 1.24 | 1.81 | 1.36 | 2.42 | 9.03 | 1.10 | 1.53 | 1.15 | 2.03 |
Source: Data derived from the 2014-2018 National Health Interview Survey SE=Standard error; CI=Confidence interval.
1 Unadjusted for covariates. 2Adjusted for age, survey year, gender, geographic region, marital status, nativity/immigrant status, educational attainment, income/poverty level, occupation, and housing tenure
Emergency room (ER) visits are associated with substantially increased health care costs.6,31 During 2014-2018, the likelihood of one or more ER visits in the past 12 months was greatest among AIAN adults (32.30%), followed by African Americans (26.30%), non-Hispanic Whites (19.02%), Hispanics (17.95%), and APIs (1 1.40%). After controlling for sociodemographic factors, AIANs had 67% higher odds of ≥1 ER visits than non-Hispanic Whites and 117% higher odds than APIs. The likelihood of two or more ER visits in the past 12 months among AIANs was 16.95%, 157% higher than non-Hispanic Whites and 406% higher than APIs. Controlling for sociodemographic factors, AIANs had 109% higher odds of ≥2 ER visits than non-Hispanic Whites and 179% higher odds than APIs (Table 11).
Hospital admission is an important health care outcome measure.31 During 2014-2018, the hospital admission rate for AIANs was 8.95%, not significantly different from the rate of 8.40% for non-Hispanic Whites but 86% higher than the rate of 4.81% for APIs and 35% higher than the rate of 6.63% for Hispanics. After adjustment for sociodemographic factors no statistically significant differences in hospital admission were found between AIANs and other racial/ethnic groups (Table 11).
The 2019 UDS data indicate the lowest rates of controlled blood pressure among African Americans (57.00%), AIANs (58.61%), and Native Hawaiians (60.31%) and highest among Asians (69.85%), non- Hispanic Whites (67.33%), and Hispanics (67.08%) (Figure 5). In 2019, 37.70% of AIAN diabetic patients had uncontrolled diabetes, compared with 30.58% of Hispanic patients, 33.73% of African Americans, 29.18% of non-Hispanic Whites, and 20.32% of Asian-American patients (Figure 5).

- (A, B) Racial/Ethnic Differences in Hypertension and Diabetes Control (%), United States, 2019 Health Center Patients Source: Health Resources and Services Administration (HRSA). Bureau of Primary Health Care. 2019 Uniform Data System (UDS). https://data.hrsa.gov/tools/data-reporting/program-data/national
HIV viral suppression among the RWHAP patients improved markedly between 2010 and 2019 for all racial/ethnic groups. For AIAN patients, the viral suppression rate increased from 70.4% in 2010 to 87.8% in 2019; for the total population, the viral suppression rate increased from 69.5% in 2010 to 88.1% in 2019 (Figure 6). Viral suppression rates in 2019 were significantly lower among AIANs (87.8%) compared with non-Hispanic Whites (91.8%), Asians (94.7%), and the general RWHAP patient population (88.1%).

- Viral Suppression Rates (%) among Ryan White HIV/AIDS Program Clients (non-ADAP), by Race/ethnicity, 2010 and 2019, United States and Territories of Guam, Puerto Rico, and US Virgin Islands
- Source: HRSA. Ryan White HIV/AIDS Program Annual Client-Level Data Report, December 2020
Discussion
In this paper, we have analyzed major health and social inequality trends among AIANs. Documenting long-term trends in mortality from various leading causes of death among AIANs and analyzing tribal- specific data on disability, health insurance, and socioeconomic conditions is a particularly novel contribution of this study.
Striking disparities are found in a number of health indicators, with AIANs experiencing lower life expectancy compared to other racial/ethnic groups except African Americans, high rates of infant mortality, premature mortality, diabetes, liver cirrhosis, alcohol-related mortality, youth suicides, and unintentional injuries than the general population and the other major racial/ethnic groups. The excess mortality among AIANs from many of these causes would be even greater if not for a significant racial misclassification and an underreporting of AIAN ethnicity on death certificates.10,13
Inequalities in mental and physical health and access to healthcare services are also very marked. Compared to any other major racial/ethnic group, AIANs are significantly more likely to rate their physical and mental health as poor. About 18% of AIANs assess their overall health as fair or poor, at twice the rate of non-Hispanic whites or the general population. About 14% of AIAN adults experience serious psychological distress, which is at least 4 times higher than the prevalence for the general population or any other major racial/ethnic group. AIANs have the highest disability and health uninsurance rates of all major racial/ethnic groups in the US. Nearly 18% of AIANs report a disability and 20% are without health insurance. Differences in disability and health insurance across the Native American tribes are even more startling. In certain tribal communities such as Seminole, Alaskan Athabascan, and Comanche, more than 33% of the population lacks health insurance.
Compatible with their health deficits, AIANs are disadvantaged in their behavioral-risk profile relative to other groups. Of all the major racial/ethnic groups, AIANs have either the highest or one of the highest rates of child and adult obesity, smoking, heavy alcohol consumption, and physical inactivity and the lowest rates of breast, cervical and colorectal cancer screening.13,24,35 Socioeconomic and material living conditions of AIANs are also less favorable compared to other groups. AIANs have the highest poverty rates of any major racial/ethnic group, with 27% of the overall AIAN population and 34% of AIAN children living in poverty. Poverty rates among many of the tribal communities are astonishingly high. For Aleut, Crow, and Sioux, more than half of children live in poverty, whereas the overall poverty rate approaches or exceeds 40% for Sioux, Tohono O'Odham, and Inupiat.
Our study findings are consistent with previous studies showing generally poorer health status and socioeconomic conditions among AIANs compared to other racial/ethnic groups in the US.6,13,25,31-33,35 In a recent study, life expectancy among AIANs in 2017 was the lowest among the five major racial/ethnic groups and 4.5 years shorter than that for non-Hispanic Whites.31 In our study, life expectancy of AIANs was 2.2 years shorter than that for non- Hispanic Whites. Evidence from the 1979-2011 US National Longitudinal Mortality Study, in which race/ethnicity is self-reported in the population cohorts subject to mortality follow-up, indicates a 15-to-20% higher age-adjusted mortality among AIANs than non-Hispanic Whites for population aged ≥18 and a higher mortality risk among AIANs aged 25-64 years, the latter finding being consistent with our study.29,31,38 Analysis of the 1997-2014 National Health Interview Survey-National Death Index Record Linkage Study showed higher age-adjusted risks of all-cause and heart disease mortality among AIANs compared with non-Hispanic Whites.32,39 Previous studies have reported higher rates of self-assessed fair/poor health, SPD, disability, uninsurance, smoking, hypertension, and obesity among AIANs relative to non-Hispanic Whites, a pattern consistent with our study.13,25,29,31
Despite these health and health care deficits among AIANs relative to other racial/ethnic groups, the gap in health status and life expectancy between AIANs and US Whites is not as large as those seen in New Zealand, Australia, and Canada between the indigenous groups such as Maoris or Aboriginals and the majority White population.40,41 For example, the gap in life expectancy between indigenous (First Nations) and non-indigenous populations in Canada is at least 6 years; between Maoris and non-Maoris in New Zealand is 7.1 years; and between indigenous and non- indigenous populations in Australia is about 10 years.41
Conclusions and Implications for Translational Research
American Indians and Alaska Natives remain a disadvantaged segment of the US population in a number of key health indicators and in socioeconomic and living conditions, with poverty rates in some tribal groups approaching or exceeding 40%. Although reduced smoking, greater physical activity, lower obesity, healthy diet, higher seatbelt use, avoiding substance use, and improved access to and use of quality health care services can lead to improvements in the health of AIANs, these factors are themselves primarily influenced by broader, more upstream social determinants such as education, income, social and welfare services, affordable housing, job creation, labor market opportunities, and transportation.6,16,35 Addressing inequities in these social determinants should be an important policy focus for tackling health inequalities among AIANs and those between AIANs and other racial/ethnic groups in the United States.
Compliance with Ethical Standards
Conflicts of interest:
The authors declare that they have no conflict of interest.
Ethical approval:
No IRB approval was required for this study, which is based on the secondary analysis of public-use federal databases.
Financial Disclosure:
None to report.
Disclaimer:
The views expressed in this article are the authors' and not necessarily those of the Health Resources and Services Administration or the US Department of Health and Human Services.
Acknowledgments:
None.
Funding source:
Hyunjung Lee was supported in part by an appointment to the Research Participation Program at the Health Resources & Services Administration - Office of Health Equity (HRSA-OHE), administered by the Oak Ridge Institute for Science and Education (ORISE) through an interagency agreement between the US Department of Energy and HRSA.
References
- 2010. The effects of removal on American Indian tribes. (accessed )
- Health behaviors and risk factors among American Indians and Alaska Natives, 2000-2010. Am J Public Health. 2014;104(Suppl 3):S481-489.
- [CrossRef] [PubMed] [Google Scholar]
- The association of panic disorder, posttraumatic stress disorder, and major depression with smoking in American Indians. Nicotine Tob Res. 2016;18(3):259-266.
- [CrossRef] [PubMed] [Google Scholar]
- Health- related quality of life—United States, 2006 and 2010. In: MMWR Suppl. Vol 62. Centers for Disease Control and Prevention; 2013. p. :105-111. (accessed )
- [Google Scholar]
- Social determinants of health in the United States: addressing major health inequality trends for the nation, 1935-2016. Int J MCH AIDS. 2017;6(2):139-164.
- [CrossRef] [PubMed] [Google Scholar]
- Prevalence and characteristics of sexual violence, stalking, and intimate partner violence victimization—national intimate partner and sexual violence survey, United States, 2011. 2015. Am J Public Health. 105:e11-e12. (accessed )
- [CrossRef] [Google Scholar]
- High food insecurity and its correlates among families living on a rural American Indian Reservation. Am J Public Health. 2012;102(7):1346-1352.
- [CrossRef] [PubMed] [Google Scholar]
- Addressing Child Hunger And Obesity In Indian Country: Report To Congress. In: Office of Research and Evaluation. Alexandria, VA: USDA Food and Nutrition service; 2012. (accessed )
- [Google Scholar]
- Disparities in cancer mortality and incidence among American Indians and Alaska Natives in the United States. Am J Public Health. 2014;104(Suppl 3):S377-387.
- [CrossRef] [PubMed] [Google Scholar]
- Health promotion and diabetes prevention in American Indian and Alaska native communities — traditional foods project, 2008-2014. MMWR Suppl. 2016;65(1):4-10.
- [CrossRef] [PubMed] [Google Scholar]
- Health, United States, 2015: With Special Feature on Racial and Ethnic Health Disparities. Hyattsville, MD: US Department of Health and Human Services; 2016.
- Current cigarette smoking among adults - United States, 2016. MMWR Morb Mortal Wkly Rep. 2018;67(2):53-59.
- [CrossRef] [PubMed] [Google Scholar]
- Disparities. (accessed )
- Widening rural-urban disparities in life expectancy, U.S., 1969-2009. Am J Prev Med. 2014;46(2):e19-e29.
- [CrossRef] [PubMed] [Google Scholar]
- 2020. The American Community Survey. (accessed )
- 2021. HRSA: Agency Overview. (accessed )
- 2019. 2020. National Health Center Data, Uniform Data System. Rockville, Maryland: Bureau of Primary Health Care; (accessed )
- Ryan White HIV/AIDS Program Annual Client-Level Data Report 2019. December 2020 (accessed )
- The U.S. National vital statistics system:Transitioning into the 21st century, 1990-2017. In: Vital Health Stat. Vol 1. National Center for Health Statistics; 2018. p. :1-84.
- [Google Scholar]
- 2020. National Vital Statistics System, Mortality Multiple Cause-of-Death Public Use Data File Documentation. Hyattsville, MD: US Department of Health and Human Services; (accessed )
- 2018. 2019. National Health Interview Survey. Hyattsville, MD: US Department of Health and Human Services; (accessed )
- 2013. Immigrant health inequalities in the United States: Use of eight major national data systems. Scientific World Journal 2013:1-21.
- [CrossRef] [PubMed] [Google Scholar]
- 2019. User Guide to the 2017 Period Linked Birth/Infant Death Public Use File. Hyattsville, MD: Centers for Disease Control and Prevention, US Department of Health and Human Services; (accessed )
- 2020. National Vital Statistics System, 2015-2018 Natality Public Use Files and User Guide. Hyattsville, MD: US Department of Health and Human Services; (accessed )
- 2020. The American Community Survey (ACS) Public Use Microdata Sample (PUMS) 2014-2018;. (accessed )
- Marked ethnic, nativity, and socioeconomic disparities in disability and health insurance among US children and adults: The 2008-2010 American Community Survey. BioMed Res Int 2013:1-17.
- [CrossRef] [PubMed] [Google Scholar]
- The National Health Interview Survey, Questionnaires, Datasets, and Related Documentation: 2014- 2018 Public Use Data Files. 2019. Hyattsville, MD: US Department of Health and Human Services; (accessed )
- [Google Scholar]
- 2020. Health Equity Report, 2019-2020: Special Feature on Housing and Health Inequalities. (accessed )
- Psychological distress, life expectancy; and all- cause mortality in the United States: results from the 1997-2014 NHIS-NDI record linkage study. Ann Epidemiol. 2021;56:9-17.
- [CrossRef] [PubMed] [Google Scholar]
- Widening socioeconomic and racial disparities in cardiovascular disease mortality in the United States, 1969-2013. Int J MCH AIDS. 2015;3(2):106-118.
- [Google Scholar]
- Increasing area deprivation and socioeconomic inequalities in heart disease, stroke, and cardiovascular disease mortality among working age populations, United States, 1969-2011. Int J MCH and AIDS. 2015;3(2):119-133.
- [Google Scholar]
- Socioeconomic and racial/ethnic disparities in cancer mortality, incidence, and survival in the United States, 1950-2014: over six decades of changing patterns and widening Inequalities. J Environ Public Health DOI: 2017/2819372. Epub March 2017
- [Google Scholar]
- SAS Version 9.4. Cary, NC: SAS Institute Inc.; 2013.
- NC: Research Triangle Institute; 2018. Research Triangle Park
- Ethnic-immigrant differentials in health behaviors, morbidity, and cause-specific mortality in the United States: an analysis of two national data bases. Hum Biol. 2002;74(1):83-109.
- [CrossRef] [PubMed] [Google Scholar]
- Social isolation and all-cause and heart disease mortality among working-age adults in the United States: the 1998-2014 NHIS-NDI record linkage study. Health Equity. 2021;5(1):750-761.
- [CrossRef] [PubMed] [Google Scholar]
- Disparities in indigenous health: A cross-country comparison between New Zealand and the United States. Am J Public Health. 2005;95(5):844-850.
- [CrossRef] [PubMed] [Google Scholar]
- Improving health data for indigenous populations: The international group for indigenous health measurements. Stat. J IAOS. 2019;35:15-21.
- [CrossRef] [Google Scholar]